French American Indian vs Spanish American Indian 6th Grade
COMPARE
French American Indian
Spanish American Indian
6th Grade
6th Grade Comparison
French American Indians
Spanish American Indians
97.2%
6TH GRADE
74.0/ 100
METRIC RATING
151st/ 347
METRIC RANK
93.6%
6TH GRADE
0.0/ 100
METRIC RATING
346th/ 347
METRIC RANK
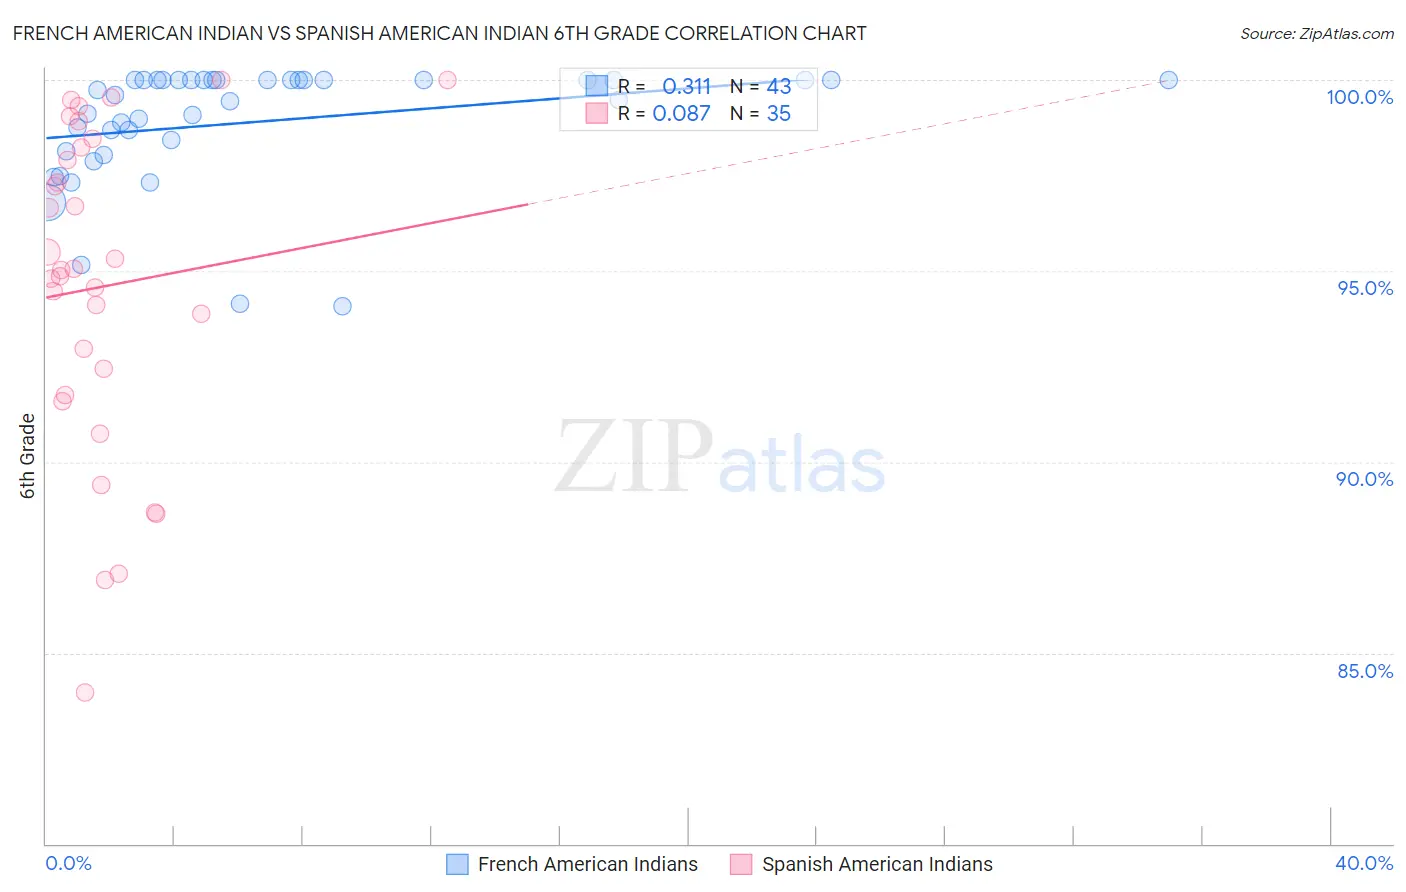
French American Indian vs Spanish American Indian 6th Grade Correlation Chart
The statistical analysis conducted on geographies consisting of 131,974,854 people shows a mild positive correlation between the proportion of French American Indians and percentage of population with at least 6th grade education in the United States with a correlation coefficient (R) of 0.311 and weighted average of 97.2%. Similarly, the statistical analysis conducted on geographies consisting of 73,150,359 people shows a slight positive correlation between the proportion of Spanish American Indians and percentage of population with at least 6th grade education in the United States with a correlation coefficient (R) of 0.087 and weighted average of 93.6%, a difference of 3.8%.
6th Grade Correlation Summary
| Measurement | French American Indian | Spanish American Indian |
| Minimum | 94.1% | 84.0% |
| Maximum | 100.0% | 100.0% |
| Range | 5.9% | 16.0% |
| Mean | 98.9% | 94.6% |
| Median | 99.6% | 95.0% |
| Interquartile 25% (IQ1) | 98.1% | 91.7% |
| Interquartile 75% (IQ3) | 100.0% | 98.2% |
| Interquartile Range (IQR) | 1.9% | 6.5% |
| Standard Deviation (Sample) | 1.6% | 4.2% |
| Standard Deviation (Population) | 1.5% | 4.1% |
Similar Demographics by 6th Grade
Demographics Similar to French American Indians by 6th Grade
In terms of 6th grade, the demographic groups most similar to French American Indians are Immigrants from Bosnia and Herzegovina (97.2%, a difference of 0.0%), Immigrants from Israel (97.2%, a difference of 0.010%), Immigrants from Jordan (97.2%, a difference of 0.010%), Immigrants from Eastern Europe (97.2%, a difference of 0.010%), and Soviet Union (97.2%, a difference of 0.010%).
| Demographics | Rating | Rank | 6th Grade |
| Israelis | 82.9 /100 | #144 | Excellent 97.2% |
| Spaniards | 80.1 /100 | #145 | Excellent 97.2% |
| Hopi | 78.8 /100 | #146 | Good 97.2% |
| Immigrants | South Central Asia | 78.1 /100 | #147 | Good 97.2% |
| Immigrants | Greece | 77.8 /100 | #148 | Good 97.2% |
| Immigrants | Israel | 76.0 /100 | #149 | Good 97.2% |
| Immigrants | Bosnia and Herzegovina | 74.8 /100 | #150 | Good 97.2% |
| French American Indians | 74.0 /100 | #151 | Good 97.2% |
| Immigrants | Jordan | 73.0 /100 | #152 | Good 97.2% |
| Immigrants | Eastern Europe | 72.6 /100 | #153 | Good 97.2% |
| Soviet Union | 71.5 /100 | #154 | Good 97.2% |
| Ute | 71.1 /100 | #155 | Good 97.1% |
| Alsatians | 69.8 /100 | #156 | Good 97.1% |
| Immigrants | Russia | 67.6 /100 | #157 | Good 97.1% |
| Immigrants | Iran | 63.3 /100 | #158 | Good 97.1% |
Demographics Similar to Spanish American Indians by 6th Grade
In terms of 6th grade, the demographic groups most similar to Spanish American Indians are Immigrants from El Salvador (93.6%, a difference of 0.040%), Immigrants from Guatemala (93.9%, a difference of 0.34%), Salvadoran (93.9%, a difference of 0.34%), Immigrants from Mexico (93.9%, a difference of 0.35%), and Immigrants from Central America (94.0%, a difference of 0.41%).
| Demographics | Rating | Rank | 6th Grade |
| Immigrants | Latin America | 0.0 /100 | #333 | Tragic 94.7% |
| Immigrants | Azores | 0.0 /100 | #334 | Tragic 94.7% |
| Mexicans | 0.0 /100 | #335 | Tragic 94.6% |
| Immigrants | Dominican Republic | 0.0 /100 | #336 | Tragic 94.6% |
| Central Americans | 0.0 /100 | #337 | Tragic 94.5% |
| Immigrants | Cabo Verde | 0.0 /100 | #338 | Tragic 94.4% |
| Yakama | 0.0 /100 | #339 | Tragic 94.3% |
| Guatemalans | 0.0 /100 | #340 | Tragic 94.2% |
| Immigrants | Yemen | 0.0 /100 | #341 | Tragic 94.1% |
| Immigrants | Central America | 0.0 /100 | #342 | Tragic 94.0% |
| Immigrants | Mexico | 0.0 /100 | #343 | Tragic 93.9% |
| Immigrants | Guatemala | 0.0 /100 | #344 | Tragic 93.9% |
| Salvadorans | 0.0 /100 | #345 | Tragic 93.9% |
| Spanish American Indians | 0.0 /100 | #346 | Tragic 93.6% |
| Immigrants | El Salvador | 0.0 /100 | #347 | Tragic 93.6% |