French American Indian vs Malaysian 6th Grade

COMPARE

French American Indian
Race
Ancestry
AfghanAfricanAlaska NativeAlaskan AthabascanAlbanianAleutAlsatianAmericanApacheArabArapahoArgentineanArmenianAssyrian/Chaldean/SyriacAustralianAustrianBahamianBangladeshiBarbadianBasqueBelgianBelizeanBermudanBhutaneseBlackfeetBolivianBrazilianBritishBritish West IndianBulgarianBurmeseCajunCambodianCanadianCape VerdeanCarpatho RusynCelticCentral AmericanCentral American IndianCherokeeCheyenneChickasawChileanChineseChippewaChoctawColombianColvilleComancheCosta RicanCreeCreekCroatianCrowCubanCypriotCzechCzechoslovakianDanishDelawareDominicanDutchDutch West IndianEastern EuropeanEcuadorianEgyptianEnglishEstonianEthiopianEuropeanFijianFilipinoFinnishFrenchFrench American IndianFrench CanadianGermanGerman RussianGhanaianGreekGuamanian/ChamorroGuatemalanGuyaneseHaitianHmongHonduranHopiHoumaHungarianIcelanderIndian (Asian)IndonesianInupiatIranianIraqiIrishIroquoisIsraeliItalianJamaicanJapaneseJordanianKenyanKiowaKoreanLaotianLatvianLebaneseLiberianLithuanianLumbeeLuxembourgerMacedonianMalteseMarshalleseMenomineeMexicanMexican American IndianMongolianMoroccanNative HawaiianNavajoNepaleseNew ZealanderNicaraguanNigerianNorthern EuropeanNorwegianOkinawanOsageOttawaPaiutePakistaniPalestinianPanamanianParaguayanPennsylvania GermanPeruvianPimaPolishPortuguesePotawatomiPuebloPuerto RicanPuget Sound SalishRomanianRussianSalvadoranSamoanScandinavianScotch-IrishScottishSeminoleSenegaleseSerbianShoshoneSierra LeoneanSiouxSlavicSlovakSloveneSomaliSouth AfricanSouth AmericanSouth American IndianSoviet UnionSpaniardSpanishSpanish AmericanSpanish American IndianSri LankanSubsaharan AfricanSudaneseSwedishSwissSyrianTaiwaneseThaiTlingit-HaidaTohono O'OdhamTonganTrinidadian and TobagonianTsimshianTurkishU.S. Virgin IslanderUgandanUkrainianUruguayanUteVenezuelanVietnameseWelshWest IndianYakamaYaquiYugoslavianYumanYup'ikZimbabwean
Immigration
NonimmigrantsImmigrantsAfghanistanAfricaAlbaniaArgentinaArmeniaAsiaAustraliaAustriaBahamasBangladeshBarbadosBelarusBelgiumBelizeBoliviaBosnia and HerzegovinaBrazilBulgariaBurma/MyanmarCabo VerdeCambodiaCameroonCanadaCaribbeanCentral AmericaChileChinaColombiaCongoCosta RicaCroatiaCubaCzechoslovakiaDenmarkDominicaDominican RepublicEastern AfricaEastern AsiaEastern EuropeEcuadorEgyptEl SalvadorEnglandEritreaEthiopiaEuropeFijiFranceGermanyGhanaGreeceGrenadaGuatemalaGuyanaHaitiHondurasHong KongHungaryIndiaIndonesiaIranIraqIrelandIsraelItalyJamaicaJapanJordanKazakhstanKenyaKoreaKuwaitLaosLatin AmericaLatviaLebanonLiberiaLithuaniaMalaysiaMexicoMicronesiaMiddle AfricaMoldovaMoroccoNepalNetherlandsNicaraguaNigeriaNorth AmericaNorth MacedoniaNorthern AfricaNorthern EuropeNorwayOceaniaPakistanPanamaPeruPhilippinesPolandPortugalRomaniaRussiaSaudi ArabiaScotlandSenegalSerbiaSierra LeoneSingaporeSomaliaSouth AfricaSouth AmericaSouth Central AsiaSouth Eastern AsiaSouthern EuropeSpainSri LankaSt. Vincent and the GrenadinesSudanSwedenSwitzerlandSyriaTaiwanThailandTrinidad and TobagoTurkeyUgandaUkraineUruguayUzbekistanVenezuelaVietnamWest IndiesWestern AfricaWestern AsiaWestern EuropeYemenZaireZimbabweAzores
Malaysian
Race
Ancestry
AfghanAfricanAlaska NativeAlaskan AthabascanAlbanianAleutAlsatianAmericanApacheArabArapahoArgentineanArmenianAssyrian/Chaldean/SyriacAustralianAustrianBahamianBangladeshiBarbadianBasqueBelgianBelizeanBermudanBhutaneseBlackfeetBolivianBrazilianBritishBritish West IndianBulgarianBurmeseCajunCambodianCanadianCape VerdeanCarpatho RusynCelticCentral AmericanCentral American IndianCherokeeCheyenneChickasawChileanChineseChippewaChoctawColombianColvilleComancheCosta RicanCreeCreekCroatianCrowCubanCypriotCzechCzechoslovakianDanishDelawareDominicanDutchDutch West IndianEastern EuropeanEcuadorianEgyptianEnglishEstonianEthiopianEuropeanFijianFilipinoFinnishFrenchFrench CanadianGermanGerman RussianGhanaianGreekGuamanian/ChamorroGuatemalanGuyaneseHaitianHmongHonduranHopiHoumaHungarianIcelanderIndian (Asian)IndonesianInupiatIranianIraqiIrishIroquoisIsraeliItalianJamaicanJapaneseJordanianKenyanKiowaKoreanLaotianLatvianLebaneseLiberianLithuanianLumbeeLuxembourgerMacedonianMalaysianMalteseMarshalleseMenomineeMexicanMexican American IndianMongolianMoroccanNative HawaiianNavajoNepaleseNew ZealanderNicaraguanNigerianNorthern EuropeanNorwegianOkinawanOsageOttawaPaiutePakistaniPalestinianPanamanianParaguayanPennsylvania GermanPeruvianPimaPolishPortuguesePotawatomiPuebloPuerto RicanPuget Sound SalishRomanianRussianSalvadoranSamoanScandinavianScotch-IrishScottishSeminoleSenegaleseSerbianShoshoneSierra LeoneanSiouxSlavicSlovakSloveneSomaliSouth AfricanSouth AmericanSouth American IndianSoviet UnionSpaniardSpanishSpanish AmericanSpanish American IndianSri LankanSubsaharan AfricanSudaneseSwedishSwissSyrianTaiwaneseThaiTlingit-HaidaTohono O'OdhamTonganTrinidadian and TobagonianTsimshianTurkishU.S. Virgin IslanderUgandanUkrainianUruguayanUteVenezuelanVietnameseWelshWest IndianYakamaYaquiYugoslavianYumanYup'ikZimbabwean
Immigration
NonimmigrantsImmigrantsAfghanistanAfricaAlbaniaArgentinaArmeniaAsiaAustraliaAustriaBahamasBangladeshBarbadosBelarusBelgiumBelizeBoliviaBosnia and HerzegovinaBrazilBulgariaBurma/MyanmarCabo VerdeCambodiaCameroonCanadaCaribbeanCentral AmericaChileChinaColombiaCongoCosta RicaCroatiaCubaCzechoslovakiaDenmarkDominicaDominican RepublicEastern AfricaEastern AsiaEastern EuropeEcuadorEgyptEl SalvadorEnglandEritreaEthiopiaEuropeFijiFranceGermanyGhanaGreeceGrenadaGuatemalaGuyanaHaitiHondurasHong KongHungaryIndiaIndonesiaIranIraqIrelandIsraelItalyJamaicaJapanJordanKazakhstanKenyaKoreaKuwaitLaosLatin AmericaLatviaLebanonLiberiaLithuaniaMalaysiaMexicoMicronesiaMiddle AfricaMoldovaMoroccoNepalNetherlandsNicaraguaNigeriaNorth AmericaNorth MacedoniaNorthern AfricaNorthern EuropeNorwayOceaniaPakistanPanamaPeruPhilippinesPolandPortugalRomaniaRussiaSaudi ArabiaScotlandSenegalSerbiaSierra LeoneSingaporeSomaliaSouth AfricaSouth AmericaSouth Central AsiaSouth Eastern AsiaSouthern EuropeSpainSri LankaSt. Vincent and the GrenadinesSudanSwedenSwitzerlandSyriaTaiwanThailandTrinidad and TobagoTurkeyUgandaUkraineUruguayUzbekistanVenezuelaVietnamWest IndiesWestern AfricaWestern AsiaWestern EuropeYemenZaireZimbabweAzores
6th Grade
Income
Poverty
Unemployment
Labor Participation
Family Structure
Vehicle Availability
Education Level
Disability

6th Grade Comparison

French American Indians

Malaysians

Good
Tragic
97.2%
6TH GRADE
74.0/ 100
METRIC RATING
151st/ 347
METRIC RANK
96.2%
6TH GRADE
0.0/ 100
METRIC RATING
288th/ 347
METRIC RANK

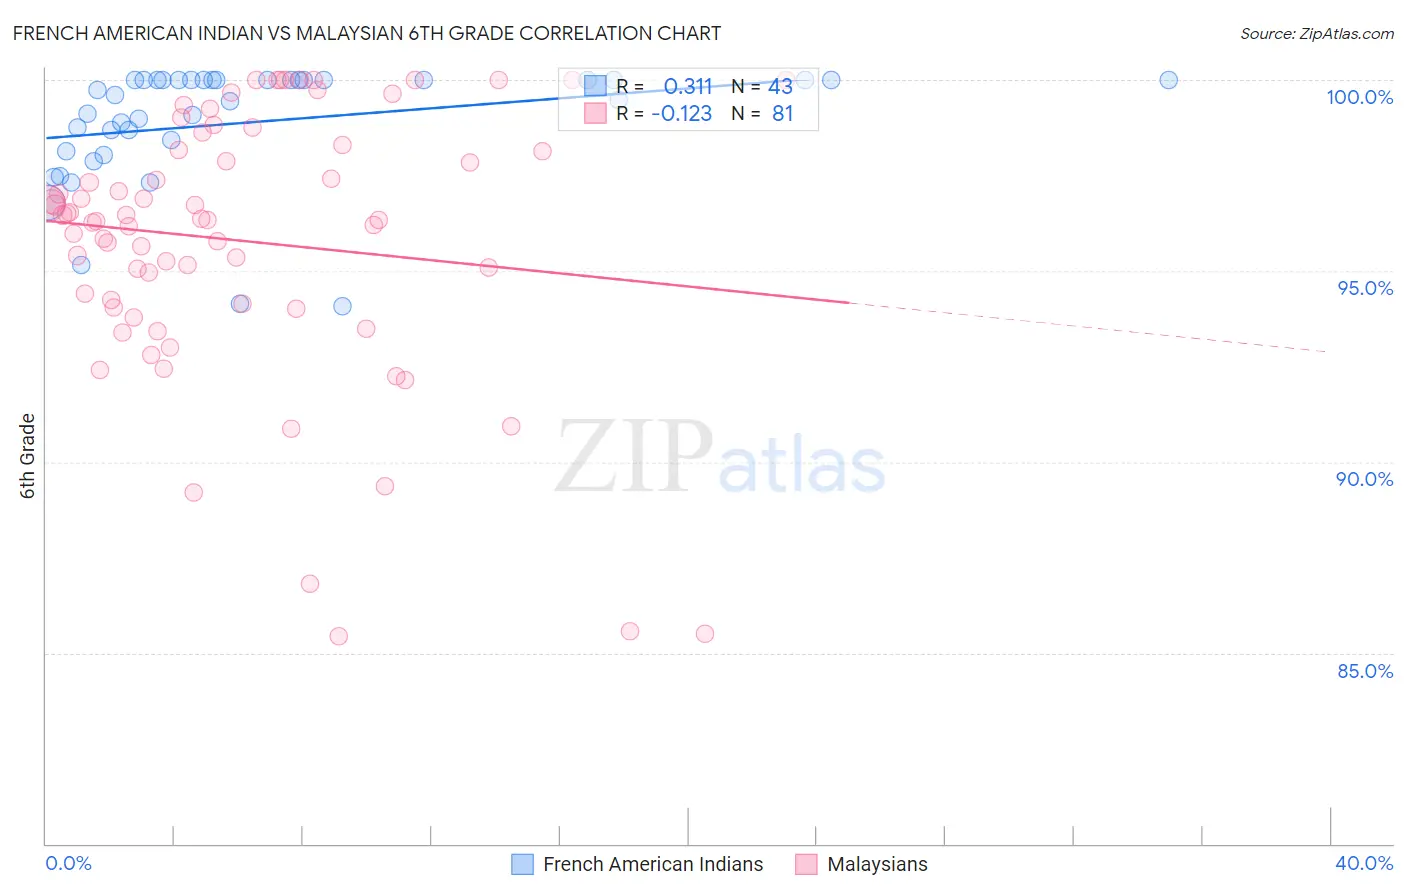
French American Indian vs Malaysian 6th Grade Correlation Chart

The statistical analysis conducted on geographies consisting of 131,974,854 people shows a mild positive correlation between the proportion of French American Indians and percentage of population with at least 6th grade education in the United States with a correlation coefficient (R) of 0.311 and weighted average of 97.2%. Similarly, the statistical analysis conducted on geographies consisting of 226,107,000 people shows a poor negative correlation between the proportion of Malaysians and percentage of population with at least 6th grade education in the United States with a correlation coefficient (R) of -0.123 and weighted average of 96.2%, a difference of 1.1%.
French American Indian vs Malaysian 6th Grade

6th Grade Correlation Summary

MeasurementFrench American IndianMalaysian
Minimum94.1%85.4%
Maximum100.0%100.0%
Range5.9%14.6%
Mean98.9%95.8%
Median99.6%96.3%
Interquartile 25% (IQ1)98.1%94.1%
Interquartile 75% (IQ3)100.0%98.2%
Interquartile Range (IQR)1.9%4.2%
Standard Deviation (Sample)1.6%3.5%
Standard Deviation (Population)1.5%3.4%

Similar Demographics by 6th Grade

Demographics Similar to French American Indians by 6th Grade

In terms of 6th grade, the demographic groups most similar to French American Indians are Immigrants from Bosnia and Herzegovina (97.2%, a difference of 0.0%), Immigrants from Israel (97.2%, a difference of 0.010%), Immigrants from Jordan (97.2%, a difference of 0.010%), Immigrants from Eastern Europe (97.2%, a difference of 0.010%), and Soviet Union (97.2%, a difference of 0.010%).
DemographicsRating | Rank6th Grade
Israelis
82.9
/100
|
#144
Excellent
97.2%
Spaniards
80.1
/100
|
#145
Excellent
97.2%
Hopi
78.8
/100
|
#146
Good
97.2%
Immigrants | South Central Asia
78.1
/100
|
#147
Good
97.2%
Immigrants | Greece
77.8
/100
|
#148
Good
97.2%
Immigrants | Israel
76.0
/100
|
#149
Good
97.2%
Immigrants | Bosnia and Herzegovina
74.8
/100
|
#150
Good
97.2%
French American Indians
74.0
/100
|
#151
Good
97.2%
Immigrants | Jordan
73.0
/100
|
#152
Good
97.2%
Immigrants | Eastern Europe
72.6
/100
|
#153
Good
97.2%
Soviet Union
71.5
/100
|
#154
Good
97.2%
Ute
71.1
/100
|
#155
Good
97.1%
Alsatians
69.8
/100
|
#156
Good
97.1%
Immigrants | Russia
67.6
/100
|
#157
Good
97.1%
Immigrants | Iran
63.3
/100
|
#158
Good
97.1%

Demographics Similar to Malaysians by 6th Grade

In terms of 6th grade, the demographic groups most similar to Malaysians are Immigrants from Trinidad and Tobago (96.2%, a difference of 0.010%), Barbadian (96.2%, a difference of 0.020%), Immigrants from Eritrea (96.1%, a difference of 0.020%), Immigrants from Somalia (96.1%, a difference of 0.040%), and Immigrants from St. Vincent and the Grenadines (96.1%, a difference of 0.040%).
DemographicsRating | Rank6th Grade
Trinidadians and Tobagonians
0.1
/100
|
#281
Tragic
96.2%
Houma
0.1
/100
|
#282
Tragic
96.2%
Cubans
0.1
/100
|
#283
Tragic
96.2%
Fijians
0.1
/100
|
#284
Tragic
96.2%
Somalis
0.1
/100
|
#285
Tragic
96.2%
Barbadians
0.0
/100
|
#286
Tragic
96.2%
Immigrants | Trinidad and Tobago
0.0
/100
|
#287
Tragic
96.2%
Malaysians
0.0
/100
|
#288
Tragic
96.2%
Immigrants | Eritrea
0.0
/100
|
#289
Tragic
96.1%
Immigrants | Somalia
0.0
/100
|
#290
Tragic
96.1%
Immigrants | St. Vincent and the Grenadines
0.0
/100
|
#291
Tragic
96.1%
Immigrants | Barbados
0.0
/100
|
#292
Tragic
96.1%
Immigrants | West Indies
0.0
/100
|
#293
Tragic
96.1%
British West Indians
0.0
/100
|
#294
Tragic
96.0%
Immigrants | Grenada
0.0
/100
|
#295
Tragic
95.9%