Ecuadorian vs Immigrants from China 7th Grade

COMPARE

Ecuadorian
Race
Ancestry
AfghanAfricanAlaska NativeAlaskan AthabascanAlbanianAleutAlsatianAmericanApacheArabArapahoArgentineanArmenianAssyrian/Chaldean/SyriacAustralianAustrianBahamianBangladeshiBarbadianBasqueBelgianBelizeanBermudanBhutaneseBlackfeetBolivianBrazilianBritishBritish West IndianBulgarianBurmeseCajunCambodianCanadianCape VerdeanCarpatho RusynCelticCentral AmericanCentral American IndianCherokeeCheyenneChickasawChileanChineseChippewaChoctawColombianColvilleComancheCosta RicanCreeCreekCroatianCrowCubanCypriotCzechCzechoslovakianDanishDelawareDominicanDutchDutch West IndianEastern EuropeanEcuadorianEgyptianEnglishEstonianEthiopianEuropeanFijianFilipinoFinnishFrenchFrench American IndianFrench CanadianGermanGerman RussianGhanaianGreekGuamanian/ChamorroGuatemalanGuyaneseHaitianHmongHonduranHopiHoumaHungarianIcelanderIndian (Asian)IndonesianInupiatIranianIraqiIrishIroquoisIsraeliItalianJamaicanJapaneseJordanianKenyanKiowaKoreanLaotianLatvianLebaneseLiberianLithuanianLumbeeLuxembourgerMacedonianMalaysianMalteseMarshalleseMenomineeMexicanMexican American IndianMongolianMoroccanNative HawaiianNavajoNepaleseNew ZealanderNicaraguanNigerianNorthern EuropeanNorwegianOkinawanOsageOttawaPaiutePakistaniPalestinianPanamanianParaguayanPennsylvania GermanPeruvianPimaPolishPortuguesePotawatomiPuebloPuerto RicanPuget Sound SalishRomanianRussianSalvadoranSamoanScandinavianScotch-IrishScottishSeminoleSenegaleseSerbianShoshoneSierra LeoneanSiouxSlavicSlovakSloveneSomaliSouth AfricanSouth AmericanSouth American IndianSoviet UnionSpaniardSpanishSpanish AmericanSpanish American IndianSri LankanSubsaharan AfricanSudaneseSwedishSwissSyrianTaiwaneseThaiTlingit-HaidaTohono O'OdhamTonganTrinidadian and TobagonianTsimshianTurkishU.S. Virgin IslanderUgandanUkrainianUruguayanUteVenezuelanVietnameseWelshWest IndianYakamaYaquiYugoslavianYumanYup'ikZimbabwean
Immigration
NonimmigrantsImmigrantsAfghanistanAfricaAlbaniaArgentinaArmeniaAsiaAustraliaAustriaBahamasBangladeshBarbadosBelarusBelgiumBelizeBoliviaBosnia and HerzegovinaBrazilBulgariaBurma/MyanmarCabo VerdeCambodiaCameroonCanadaCaribbeanCentral AmericaChileColombiaCongoCosta RicaCroatiaCubaCzechoslovakiaDenmarkDominicaDominican RepublicEastern AfricaEastern AsiaEastern EuropeEcuadorEgyptEl SalvadorEnglandEritreaEthiopiaEuropeFijiFranceGermanyGhanaGreeceGrenadaGuatemalaGuyanaHaitiHondurasHong KongHungaryIndiaIndonesiaIranIraqIrelandIsraelItalyJamaicaJapanJordanKazakhstanKenyaKoreaKuwaitLaosLatin AmericaLatviaLebanonLiberiaLithuaniaMalaysiaMexicoMicronesiaMiddle AfricaMoldovaMoroccoNepalNetherlandsNicaraguaNigeriaNorth AmericaNorth MacedoniaNorthern AfricaNorthern EuropeNorwayOceaniaPakistanPanamaPeruPhilippinesPolandPortugalRomaniaRussiaSaudi ArabiaScotlandSenegalSerbiaSierra LeoneSingaporeSomaliaSouth AfricaSouth AmericaSouth Central AsiaSouth Eastern AsiaSouthern EuropeSpainSri LankaSt. Vincent and the GrenadinesSudanSwedenSwitzerlandSyriaTaiwanThailandTrinidad and TobagoTurkeyUgandaUkraineUruguayUzbekistanVenezuelaVietnamWest IndiesWestern AfricaWestern AsiaWestern EuropeYemenZaireZimbabweAzores
Immigrants from China
Race
Ancestry
AfghanAfricanAlaska NativeAlaskan AthabascanAlbanianAleutAlsatianAmericanApacheArabArapahoArgentineanArmenianAssyrian/Chaldean/SyriacAustralianAustrianBahamianBangladeshiBarbadianBasqueBelgianBelizeanBermudanBhutaneseBlackfeetBolivianBrazilianBritishBritish West IndianBulgarianBurmeseCajunCambodianCanadianCape VerdeanCarpatho RusynCelticCentral AmericanCentral American IndianCherokeeCheyenneChickasawChileanChineseChippewaChoctawColombianColvilleComancheCosta RicanCreeCreekCroatianCrowCubanCypriotCzechCzechoslovakianDanishDelawareDominicanDutchDutch West IndianEastern EuropeanEgyptianEnglishEstonianEthiopianEuropeanFijianFilipinoFinnishFrenchFrench American IndianFrench CanadianGermanGerman RussianGhanaianGreekGuamanian/ChamorroGuatemalanGuyaneseHaitianHmongHonduranHopiHoumaHungarianIcelanderIndian (Asian)IndonesianInupiatIranianIraqiIrishIroquoisIsraeliItalianJamaicanJapaneseJordanianKenyanKiowaKoreanLaotianLatvianLebaneseLiberianLithuanianLumbeeLuxembourgerMacedonianMalaysianMalteseMarshalleseMenomineeMexicanMexican American IndianMongolianMoroccanNative HawaiianNavajoNepaleseNew ZealanderNicaraguanNigerianNorthern EuropeanNorwegianOkinawanOsageOttawaPaiutePakistaniPalestinianPanamanianParaguayanPennsylvania GermanPeruvianPimaPolishPortuguesePotawatomiPuebloPuerto RicanPuget Sound SalishRomanianRussianSalvadoranSamoanScandinavianScotch-IrishScottishSeminoleSenegaleseSerbianShoshoneSierra LeoneanSiouxSlavicSlovakSloveneSomaliSouth AfricanSouth AmericanSouth American IndianSoviet UnionSpaniardSpanishSpanish AmericanSpanish American IndianSri LankanSubsaharan AfricanSudaneseSwedishSwissSyrianTaiwaneseThaiTlingit-HaidaTohono O'OdhamTonganTrinidadian and TobagonianTsimshianTurkishU.S. Virgin IslanderUgandanUkrainianUruguayanUteVenezuelanVietnameseWelshWest IndianYakamaYaquiYugoslavianYumanYup'ikZimbabwean
Immigration
NonimmigrantsImmigrantsAfghanistanAfricaAlbaniaArgentinaArmeniaAsiaAustraliaAustriaBahamasBangladeshBarbadosBelarusBelgiumBelizeBoliviaBosnia and HerzegovinaBrazilBulgariaBurma/MyanmarCabo VerdeCambodiaCameroonCanadaCaribbeanCentral AmericaChileChinaColombiaCongoCosta RicaCroatiaCubaCzechoslovakiaDenmarkDominicaDominican RepublicEastern AfricaEastern AsiaEastern EuropeEcuadorEgyptEl SalvadorEnglandEritreaEthiopiaEuropeFijiFranceGermanyGhanaGreeceGrenadaGuatemalaGuyanaHaitiHondurasHong KongHungaryIndiaIndonesiaIranIraqIrelandIsraelItalyJamaicaJapanJordanKazakhstanKenyaKoreaKuwaitLaosLatin AmericaLatviaLebanonLiberiaLithuaniaMalaysiaMexicoMicronesiaMiddle AfricaMoldovaMoroccoNepalNetherlandsNicaraguaNigeriaNorth AmericaNorth MacedoniaNorthern AfricaNorthern EuropeNorwayOceaniaPakistanPanamaPeruPhilippinesPolandPortugalRomaniaRussiaSaudi ArabiaScotlandSenegalSerbiaSierra LeoneSingaporeSomaliaSouth AfricaSouth AmericaSouth Central AsiaSouth Eastern AsiaSouthern EuropeSpainSri LankaSt. Vincent and the GrenadinesSudanSwedenSwitzerlandSyriaTaiwanThailandTrinidad and TobagoTurkeyUgandaUkraineUruguayUzbekistanVenezuelaVietnamWest IndiesWestern AfricaWestern AsiaWestern EuropeYemenZaireZimbabweAzores
7th Grade
Income
Poverty
Unemployment
Labor Participation
Family Structure
Vehicle Availability
Education Level
Disability

7th Grade Comparison

Ecuadorians

Immigrants from China

Tragic
Tragic
94.0%
7TH GRADE
0.0/ 100
METRIC RATING
309th/ 347
METRIC RANK
95.3%
7TH GRADE
0.7/ 100
METRIC RATING
256th/ 347
METRIC RANK

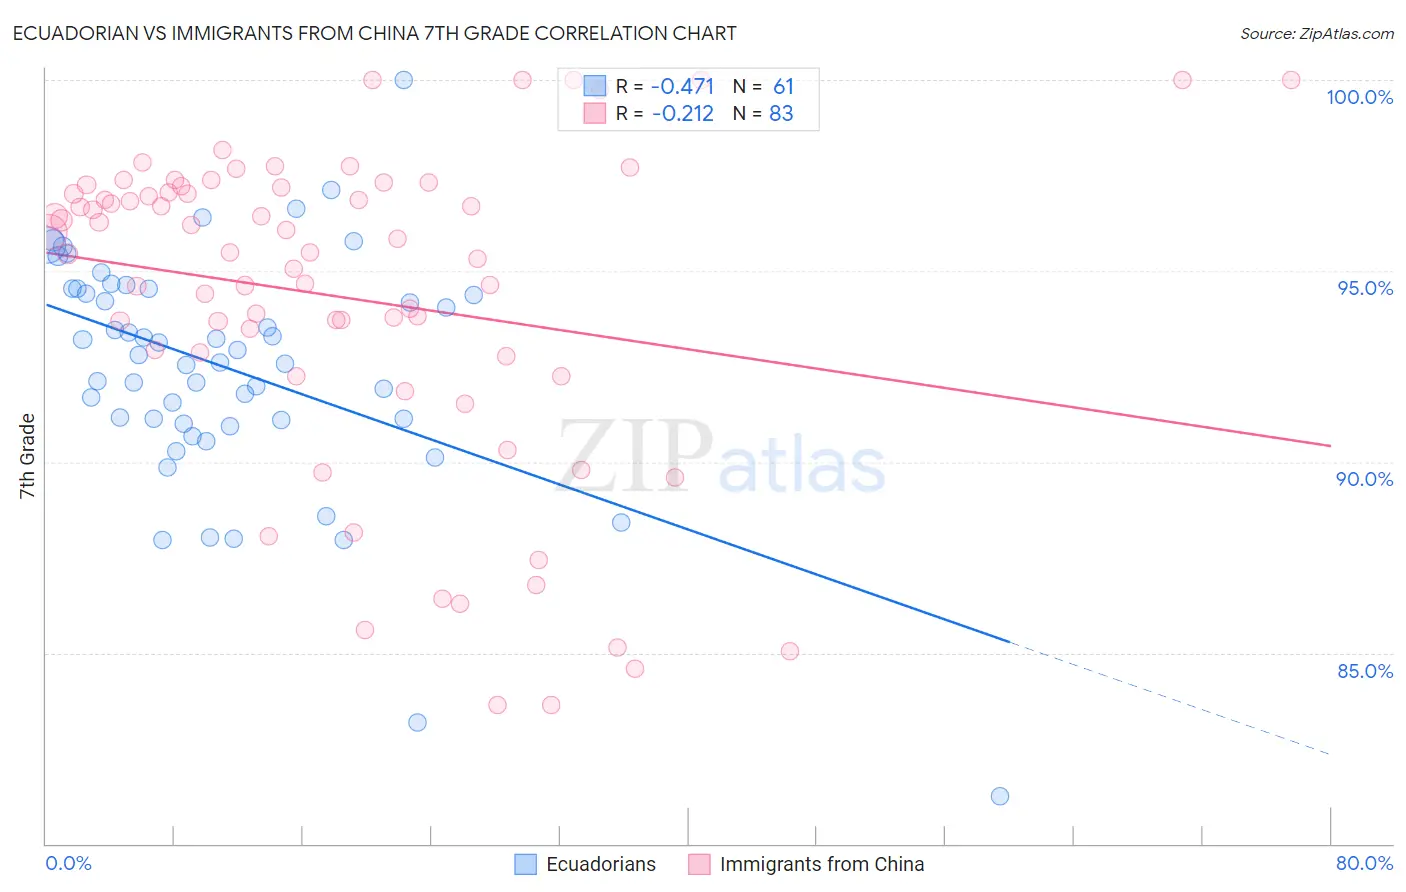
Ecuadorian vs Immigrants from China 7th Grade Correlation Chart

The statistical analysis conducted on geographies consisting of 317,753,005 people shows a moderate negative correlation between the proportion of Ecuadorians and percentage of population with at least 7th grade education in the United States with a correlation coefficient (R) of -0.471 and weighted average of 94.0%. Similarly, the statistical analysis conducted on geographies consisting of 457,082,957 people shows a weak negative correlation between the proportion of Immigrants from China and percentage of population with at least 7th grade education in the United States with a correlation coefficient (R) of -0.212 and weighted average of 95.3%, a difference of 1.3%.
Ecuadorian vs Immigrants from China 7th Grade

7th Grade Correlation Summary

MeasurementEcuadorianImmigrants from China
Minimum81.2%83.6%
Maximum100.0%100.0%
Range18.7%16.4%
Mean92.4%94.3%
Median92.8%95.5%
Interquartile 25% (IQ1)91.0%92.8%
Interquartile 75% (IQ3)94.5%97.2%
Interquartile Range (IQR)3.5%4.4%
Standard Deviation (Sample)3.1%4.2%
Standard Deviation (Population)3.1%4.2%

Similar Demographics by 7th Grade

Demographics Similar to Ecuadorians by 7th Grade

In terms of 7th grade, the demographic groups most similar to Ecuadorians are Immigrants from Caribbean (94.0%, a difference of 0.010%), Puerto Rican (94.0%, a difference of 0.020%), Cape Verdean (94.1%, a difference of 0.060%), Immigrants (94.0%, a difference of 0.060%), and Immigrants from Bangladesh (94.0%, a difference of 0.070%).
DemographicsRating | Rank7th Grade
Immigrants | Laos
0.0
/100
|
#302
Tragic
94.5%
Sri Lankans
0.0
/100
|
#303
Tragic
94.4%
Immigrants | Haiti
0.0
/100
|
#304
Tragic
94.3%
Guyanese
0.0
/100
|
#305
Tragic
94.3%
Immigrants | Guyana
0.0
/100
|
#306
Tragic
94.2%
Immigrants | Portugal
0.0
/100
|
#307
Tragic
94.2%
Cape Verdeans
0.0
/100
|
#308
Tragic
94.1%
Ecuadorians
0.0
/100
|
#309
Tragic
94.0%
Immigrants | Caribbean
0.0
/100
|
#310
Tragic
94.0%
Puerto Ricans
0.0
/100
|
#311
Tragic
94.0%
Immigrants | Immigrants
0.0
/100
|
#312
Tragic
94.0%
Immigrants | Bangladesh
0.0
/100
|
#313
Tragic
94.0%
Japanese
0.0
/100
|
#314
Tragic
94.0%
Vietnamese
0.0
/100
|
#315
Tragic
93.9%
Immigrants | Vietnam
0.0
/100
|
#316
Tragic
93.9%

Demographics Similar to Immigrants from China by 7th Grade

In terms of 7th grade, the demographic groups most similar to Immigrants from China are Immigrants from Congo (95.3%, a difference of 0.0%), Ghanaian (95.3%, a difference of 0.0%), Korean (95.3%, a difference of 0.010%), Colombian (95.3%, a difference of 0.020%), and Immigrants from Ethiopia (95.3%, a difference of 0.030%).
DemographicsRating | Rank7th Grade
Bolivians
1.1
/100
|
#249
Tragic
95.4%
Immigrants | Cameroon
0.9
/100
|
#250
Tragic
95.4%
Immigrants | Jamaica
0.9
/100
|
#251
Tragic
95.4%
Immigrants | Ethiopia
0.9
/100
|
#252
Tragic
95.3%
Somalis
0.9
/100
|
#253
Tragic
95.3%
Colombians
0.8
/100
|
#254
Tragic
95.3%
Koreans
0.8
/100
|
#255
Tragic
95.3%
Immigrants | China
0.7
/100
|
#256
Tragic
95.3%
Immigrants | Congo
0.7
/100
|
#257
Tragic
95.3%
Ghanaians
0.7
/100
|
#258
Tragic
95.3%
Immigrants | Costa Rica
0.6
/100
|
#259
Tragic
95.3%
Afghans
0.5
/100
|
#260
Tragic
95.3%
South Americans
0.5
/100
|
#261
Tragic
95.2%
Immigrants | Somalia
0.5
/100
|
#262
Tragic
95.2%
West Indians
0.5
/100
|
#263
Tragic
95.2%