Dominican vs Immigrants from Somalia Bachelor's Degree

COMPARE

Dominican
Race
Ancestry
AfghanAfricanAlaska NativeAlaskan AthabascanAlbanianAleutAlsatianAmericanApacheArabArapahoArgentineanArmenianAssyrian/Chaldean/SyriacAustralianAustrianBahamianBangladeshiBarbadianBasqueBelgianBelizeanBermudanBhutaneseBlackfeetBolivianBrazilianBritishBritish West IndianBulgarianBurmeseCajunCambodianCanadianCape VerdeanCarpatho RusynCelticCentral AmericanCentral American IndianCherokeeCheyenneChickasawChileanChineseChippewaChoctawColombianColvilleComancheCosta RicanCreeCreekCroatianCrowCubanCypriotCzechCzechoslovakianDanishDelawareDominicanDutchDutch West IndianEastern EuropeanEcuadorianEgyptianEnglishEstonianEthiopianEuropeanFijianFilipinoFinnishFrenchFrench American IndianFrench CanadianGermanGerman RussianGhanaianGreekGuamanian/ChamorroGuatemalanGuyaneseHaitianHmongHonduranHopiHoumaHungarianIcelanderIndian (Asian)IndonesianInupiatIranianIraqiIrishIroquoisIsraeliItalianJamaicanJapaneseJordanianKenyanKiowaKoreanLaotianLatvianLebaneseLiberianLithuanianLumbeeLuxembourgerMacedonianMalaysianMalteseMarshalleseMenomineeMexicanMexican American IndianMongolianMoroccanNative HawaiianNavajoNepaleseNew ZealanderNicaraguanNigerianNorthern EuropeanNorwegianOkinawanOsageOttawaPaiutePakistaniPalestinianPanamanianParaguayanPennsylvania GermanPeruvianPimaPolishPortuguesePotawatomiPuebloPuerto RicanPuget Sound SalishRomanianRussianSalvadoranSamoanScandinavianScotch-IrishScottishSeminoleSenegaleseSerbianShoshoneSierra LeoneanSiouxSlavicSlovakSloveneSomaliSouth AfricanSouth AmericanSouth American IndianSoviet UnionSpaniardSpanishSpanish AmericanSpanish American IndianSri LankanSubsaharan AfricanSudaneseSwedishSwissSyrianTaiwaneseThaiTlingit-HaidaTohono O'OdhamTonganTrinidadian and TobagonianTsimshianTurkishU.S. Virgin IslanderUgandanUkrainianUruguayanUteVenezuelanVietnameseWelshWest IndianYakamaYaquiYugoslavianYumanYup'ikZimbabwean
Immigration
NonimmigrantsImmigrantsAfghanistanAfricaAlbaniaArgentinaArmeniaAsiaAustraliaAustriaBahamasBangladeshBarbadosBelarusBelgiumBelizeBoliviaBosnia and HerzegovinaBrazilBulgariaBurma/MyanmarCabo VerdeCambodiaCameroonCanadaCaribbeanCentral AmericaChileChinaColombiaCongoCosta RicaCroatiaCubaCzechoslovakiaDenmarkDominicaDominican RepublicEastern AfricaEastern AsiaEastern EuropeEcuadorEgyptEl SalvadorEnglandEritreaEthiopiaEuropeFijiFranceGermanyGhanaGreeceGrenadaGuatemalaGuyanaHaitiHondurasHong KongHungaryIndiaIndonesiaIranIraqIrelandIsraelItalyJamaicaJapanJordanKazakhstanKenyaKoreaKuwaitLaosLatin AmericaLatviaLebanonLiberiaLithuaniaMalaysiaMexicoMicronesiaMiddle AfricaMoldovaMoroccoNepalNetherlandsNicaraguaNigeriaNorth AmericaNorth MacedoniaNorthern AfricaNorthern EuropeNorwayOceaniaPakistanPanamaPeruPhilippinesPolandPortugalRomaniaRussiaSaudi ArabiaScotlandSenegalSerbiaSierra LeoneSingaporeSouth AfricaSouth AmericaSouth Central AsiaSouth Eastern AsiaSouthern EuropeSpainSri LankaSt. Vincent and the GrenadinesSudanSwedenSwitzerlandSyriaTaiwanThailandTrinidad and TobagoTurkeyUgandaUkraineUruguayUzbekistanVenezuelaVietnamWest IndiesWestern AfricaWestern AsiaWestern EuropeYemenZaireZimbabweAzores
Immigrants from Somalia
Race
Ancestry
AfghanAfricanAlaska NativeAlaskan AthabascanAlbanianAleutAlsatianAmericanApacheArabArapahoArgentineanArmenianAssyrian/Chaldean/SyriacAustralianAustrianBahamianBangladeshiBarbadianBasqueBelgianBelizeanBermudanBhutaneseBlackfeetBolivianBrazilianBritishBritish West IndianBulgarianBurmeseCajunCambodianCanadianCape VerdeanCarpatho RusynCelticCentral AmericanCentral American IndianCherokeeCheyenneChickasawChileanChineseChippewaChoctawColombianColvilleComancheCosta RicanCreeCreekCroatianCrowCubanCypriotCzechCzechoslovakianDanishDelawareDutchDutch West IndianEastern EuropeanEcuadorianEgyptianEnglishEstonianEthiopianEuropeanFijianFilipinoFinnishFrenchFrench American IndianFrench CanadianGermanGerman RussianGhanaianGreekGuamanian/ChamorroGuatemalanGuyaneseHaitianHmongHonduranHopiHoumaHungarianIcelanderIndian (Asian)IndonesianInupiatIranianIraqiIrishIroquoisIsraeliItalianJamaicanJapaneseJordanianKenyanKiowaKoreanLaotianLatvianLebaneseLiberianLithuanianLumbeeLuxembourgerMacedonianMalaysianMalteseMarshalleseMenomineeMexicanMexican American IndianMongolianMoroccanNative HawaiianNavajoNepaleseNew ZealanderNicaraguanNigerianNorthern EuropeanNorwegianOkinawanOsageOttawaPaiutePakistaniPalestinianPanamanianParaguayanPennsylvania GermanPeruvianPimaPolishPortuguesePotawatomiPuebloPuerto RicanPuget Sound SalishRomanianRussianSalvadoranSamoanScandinavianScotch-IrishScottishSeminoleSenegaleseSerbianShoshoneSierra LeoneanSiouxSlavicSlovakSloveneSomaliSouth AfricanSouth AmericanSouth American IndianSoviet UnionSpaniardSpanishSpanish AmericanSpanish American IndianSri LankanSubsaharan AfricanSudaneseSwedishSwissSyrianTaiwaneseThaiTlingit-HaidaTohono O'OdhamTonganTrinidadian and TobagonianTsimshianTurkishU.S. Virgin IslanderUgandanUkrainianUruguayanUteVenezuelanVietnameseWelshWest IndianYakamaYaquiYugoslavianYumanYup'ikZimbabwean
Immigration
NonimmigrantsImmigrantsAfghanistanAfricaAlbaniaArgentinaArmeniaAsiaAustraliaAustriaBahamasBangladeshBarbadosBelarusBelgiumBelizeBoliviaBosnia and HerzegovinaBrazilBulgariaBurma/MyanmarCabo VerdeCambodiaCameroonCanadaCaribbeanCentral AmericaChileChinaColombiaCongoCosta RicaCroatiaCubaCzechoslovakiaDenmarkDominicaDominican RepublicEastern AfricaEastern AsiaEastern EuropeEcuadorEgyptEl SalvadorEnglandEritreaEthiopiaEuropeFijiFranceGermanyGhanaGreeceGrenadaGuatemalaGuyanaHaitiHondurasHong KongHungaryIndiaIndonesiaIranIraqIrelandIsraelItalyJamaicaJapanJordanKazakhstanKenyaKoreaKuwaitLaosLatin AmericaLatviaLebanonLiberiaLithuaniaMalaysiaMexicoMicronesiaMiddle AfricaMoldovaMoroccoNepalNetherlandsNicaraguaNigeriaNorth AmericaNorth MacedoniaNorthern AfricaNorthern EuropeNorwayOceaniaPakistanPanamaPeruPhilippinesPolandPortugalRomaniaRussiaSaudi ArabiaScotlandSenegalSerbiaSierra LeoneSingaporeSomaliaSouth AfricaSouth AmericaSouth Central AsiaSouth Eastern AsiaSouthern EuropeSpainSri LankaSt. Vincent and the GrenadinesSudanSwedenSwitzerlandSyriaTaiwanThailandTrinidad and TobagoTurkeyUgandaUkraineUruguayUzbekistanVenezuelaVietnamWest IndiesWestern AfricaWestern AsiaWestern EuropeYemenZaireZimbabweAzores
Bachelor's Degree
Income
Poverty
Unemployment
Labor Participation
Family Structure
Vehicle Availability
Education Level
Disability

Bachelor's Degree Comparison

Dominicans

Immigrants from Somalia

Tragic
Average
31.8%
BACHELOR'S DEGREE
0.1/ 100
METRIC RATING
277th/ 347
METRIC RANK
37.9%
BACHELOR'S DEGREE
52.8/ 100
METRIC RATING
172nd/ 347
METRIC RANK

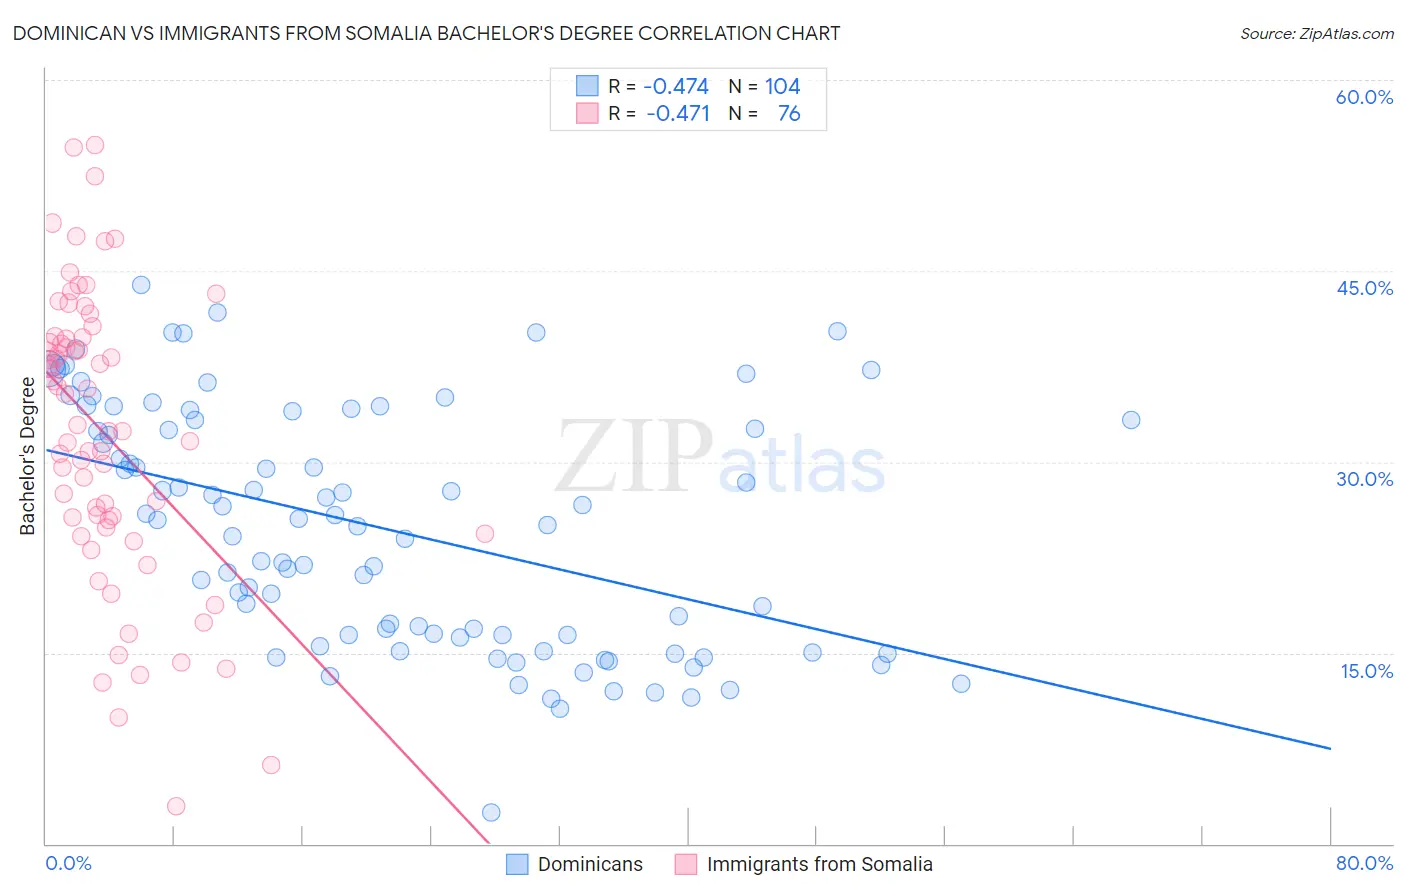
Dominican vs Immigrants from Somalia Bachelor's Degree Correlation Chart

The statistical analysis conducted on geographies consisting of 355,082,145 people shows a moderate negative correlation between the proportion of Dominicans and percentage of population with at least bachelor's degree education in the United States with a correlation coefficient (R) of -0.474 and weighted average of 31.8%. Similarly, the statistical analysis conducted on geographies consisting of 92,111,755 people shows a moderate negative correlation between the proportion of Immigrants from Somalia and percentage of population with at least bachelor's degree education in the United States with a correlation coefficient (R) of -0.471 and weighted average of 37.9%, a difference of 19.5%.
Dominican vs Immigrants from Somalia Bachelor's Degree

Bachelor's Degree Correlation Summary

MeasurementDominicanImmigrants from Somalia
Minimum2.5%2.9%
Maximum43.9%54.9%
Range41.4%52.0%
Mean24.8%32.2%
Median25.2%32.7%
Interquartile 25% (IQ1)16.3%25.1%
Interquartile 75% (IQ3)33.3%39.7%
Interquartile Range (IQR)17.0%14.6%
Standard Deviation (Sample)9.4%11.4%
Standard Deviation (Population)9.3%11.3%

Similar Demographics by Bachelor's Degree

Demographics Similar to Dominicans by Bachelor's Degree

In terms of bachelor's degree, the demographic groups most similar to Dominicans are Marshallese (31.7%, a difference of 0.050%), Salvadoran (31.8%, a difference of 0.15%), Samoan (31.8%, a difference of 0.19%), Potawatomi (31.9%, a difference of 0.32%), and American (31.9%, a difference of 0.34%).
DemographicsRating | RankBachelor's Degree
Immigrants | Nicaragua
0.2
/100
|
#270
Tragic
31.9%
Central Americans
0.2
/100
|
#271
Tragic
31.9%
Comanche
0.2
/100
|
#272
Tragic
31.9%
Americans
0.2
/100
|
#273
Tragic
31.9%
Potawatomi
0.2
/100
|
#274
Tragic
31.9%
Samoans
0.1
/100
|
#275
Tragic
31.8%
Salvadorans
0.1
/100
|
#276
Tragic
31.8%
Dominicans
0.1
/100
|
#277
Tragic
31.8%
Marshallese
0.1
/100
|
#278
Tragic
31.7%
Hawaiians
0.1
/100
|
#279
Tragic
31.6%
Immigrants | Laos
0.1
/100
|
#280
Tragic
31.6%
Blackfeet
0.1
/100
|
#281
Tragic
31.5%
Immigrants | Caribbean
0.1
/100
|
#282
Tragic
31.4%
Hondurans
0.1
/100
|
#283
Tragic
31.3%
Haitians
0.1
/100
|
#284
Tragic
31.3%

Demographics Similar to Immigrants from Somalia by Bachelor's Degree

In terms of bachelor's degree, the demographic groups most similar to Immigrants from Somalia are Immigrants from Iraq (37.9%, a difference of 0.020%), Bermudan (38.0%, a difference of 0.14%), Czech (38.0%, a difference of 0.15%), Ghanaian (38.0%, a difference of 0.25%), and Immigrants from Bangladesh (37.8%, a difference of 0.27%).
DemographicsRating | RankBachelor's Degree
Sri Lankans
59.1
/100
|
#165
Average
38.2%
Somalis
58.6
/100
|
#166
Average
38.1%
Scottish
56.6
/100
|
#167
Average
38.1%
Danes
56.2
/100
|
#168
Average
38.1%
Ghanaians
55.3
/100
|
#169
Average
38.0%
Czechs
54.4
/100
|
#170
Average
38.0%
Bermudans
54.2
/100
|
#171
Average
38.0%
Immigrants | Somalia
52.8
/100
|
#172
Average
37.9%
Immigrants | Iraq
52.5
/100
|
#173
Average
37.9%
Immigrants | Bangladesh
50.0
/100
|
#174
Average
37.8%
Immigrants | Uruguay
48.3
/100
|
#175
Average
37.8%
Costa Ricans
47.6
/100
|
#176
Average
37.7%
Basques
47.4
/100
|
#177
Average
37.7%
Immigrants | Cameroon
46.8
/100
|
#178
Average
37.7%
Immigrants | Colombia
45.4
/100
|
#179
Average
37.7%