Dominican vs Immigrants from Fiji Bachelor's Degree
COMPARE
Dominican
Immigrants from Fiji
Bachelor's Degree
Bachelor's Degree Comparison
Dominicans
Immigrants from Fiji
31.8%
BACHELOR'S DEGREE
0.1/ 100
METRIC RATING
277th/ 347
METRIC RANK
33.7%
BACHELOR'S DEGREE
1.2/ 100
METRIC RATING
245th/ 347
METRIC RANK
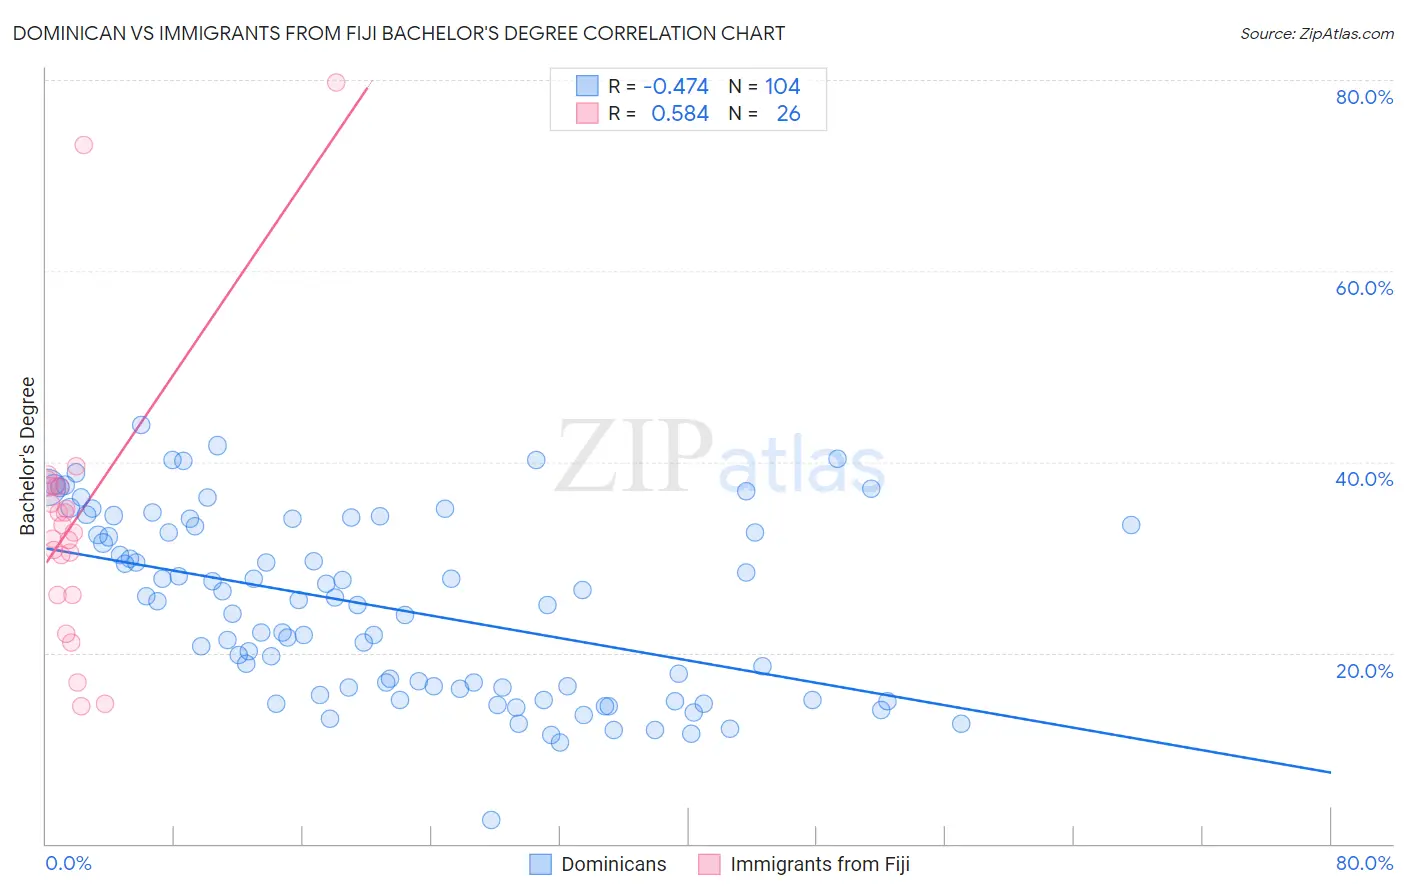
Dominican vs Immigrants from Fiji Bachelor's Degree Correlation Chart
The statistical analysis conducted on geographies consisting of 355,082,145 people shows a moderate negative correlation between the proportion of Dominicans and percentage of population with at least bachelor's degree education in the United States with a correlation coefficient (R) of -0.474 and weighted average of 31.8%. Similarly, the statistical analysis conducted on geographies consisting of 93,755,724 people shows a substantial positive correlation between the proportion of Immigrants from Fiji and percentage of population with at least bachelor's degree education in the United States with a correlation coefficient (R) of 0.584 and weighted average of 33.7%, a difference of 6.3%.
Bachelor's Degree Correlation Summary
| Measurement | Dominican | Immigrants from Fiji |
| Minimum | 2.5% | 14.4% |
| Maximum | 43.9% | 79.8% |
| Range | 41.4% | 65.4% |
| Mean | 24.8% | 34.0% |
| Median | 25.2% | 33.0% |
| Interquartile 25% (IQ1) | 16.3% | 26.1% |
| Interquartile 75% (IQ3) | 33.3% | 37.5% |
| Interquartile Range (IQR) | 17.0% | 11.4% |
| Standard Deviation (Sample) | 9.4% | 14.5% |
| Standard Deviation (Population) | 9.3% | 14.3% |
Similar Demographics by Bachelor's Degree
Demographics Similar to Dominicans by Bachelor's Degree
In terms of bachelor's degree, the demographic groups most similar to Dominicans are Marshallese (31.7%, a difference of 0.050%), Salvadoran (31.8%, a difference of 0.15%), Samoan (31.8%, a difference of 0.19%), Potawatomi (31.9%, a difference of 0.32%), and American (31.9%, a difference of 0.34%).
| Demographics | Rating | Rank | Bachelor's Degree |
| Immigrants | Nicaragua | 0.2 /100 | #270 | Tragic 31.9% |
| Central Americans | 0.2 /100 | #271 | Tragic 31.9% |
| Comanche | 0.2 /100 | #272 | Tragic 31.9% |
| Americans | 0.2 /100 | #273 | Tragic 31.9% |
| Potawatomi | 0.2 /100 | #274 | Tragic 31.9% |
| Samoans | 0.1 /100 | #275 | Tragic 31.8% |
| Salvadorans | 0.1 /100 | #276 | Tragic 31.8% |
| Dominicans | 0.1 /100 | #277 | Tragic 31.8% |
| Marshallese | 0.1 /100 | #278 | Tragic 31.7% |
| Hawaiians | 0.1 /100 | #279 | Tragic 31.6% |
| Immigrants | Laos | 0.1 /100 | #280 | Tragic 31.6% |
| Blackfeet | 0.1 /100 | #281 | Tragic 31.5% |
| Immigrants | Caribbean | 0.1 /100 | #282 | Tragic 31.4% |
| Hondurans | 0.1 /100 | #283 | Tragic 31.3% |
| Haitians | 0.1 /100 | #284 | Tragic 31.3% |
Demographics Similar to Immigrants from Fiji by Bachelor's Degree
In terms of bachelor's degree, the demographic groups most similar to Immigrants from Fiji are Delaware (33.8%, a difference of 0.090%), Jamaican (33.6%, a difference of 0.36%), Immigrants from Congo (33.6%, a difference of 0.45%), Cree (33.6%, a difference of 0.47%), and Immigrants from Guyana (33.9%, a difference of 0.59%).
| Demographics | Rating | Rank | Bachelor's Degree |
| Guyanese | 2.5 /100 | #238 | Tragic 34.5% |
| British West Indians | 2.5 /100 | #239 | Tragic 34.5% |
| Tongans | 2.0 /100 | #240 | Tragic 34.3% |
| Immigrants | Cambodia | 1.9 /100 | #241 | Tragic 34.2% |
| Immigrants | Nonimmigrants | 1.8 /100 | #242 | Tragic 34.2% |
| Immigrants | Guyana | 1.4 /100 | #243 | Tragic 33.9% |
| Delaware | 1.2 /100 | #244 | Tragic 33.8% |
| Immigrants | Fiji | 1.2 /100 | #245 | Tragic 33.7% |
| Jamaicans | 1.0 /100 | #246 | Tragic 33.6% |
| Immigrants | Congo | 1.0 /100 | #247 | Tragic 33.6% |
| Cree | 1.0 /100 | #248 | Tragic 33.6% |
| Immigrants | Liberia | 0.9 /100 | #249 | Tragic 33.5% |
| Indonesians | 0.9 /100 | #250 | Tragic 33.5% |
| Japanese | 0.7 /100 | #251 | Tragic 33.3% |
| Immigrants | Bahamas | 0.7 /100 | #252 | Tragic 33.3% |