Czech vs Lebanese Bachelor's Degree
COMPARE
Czech
Lebanese
Bachelor's Degree
Bachelor's Degree Comparison
Czechs
Lebanese
38.0%
BACHELOR'S DEGREE
54.4/ 100
METRIC RATING
170th/ 347
METRIC RANK
40.4%
BACHELOR'S DEGREE
94.3/ 100
METRIC RATING
123rd/ 347
METRIC RANK
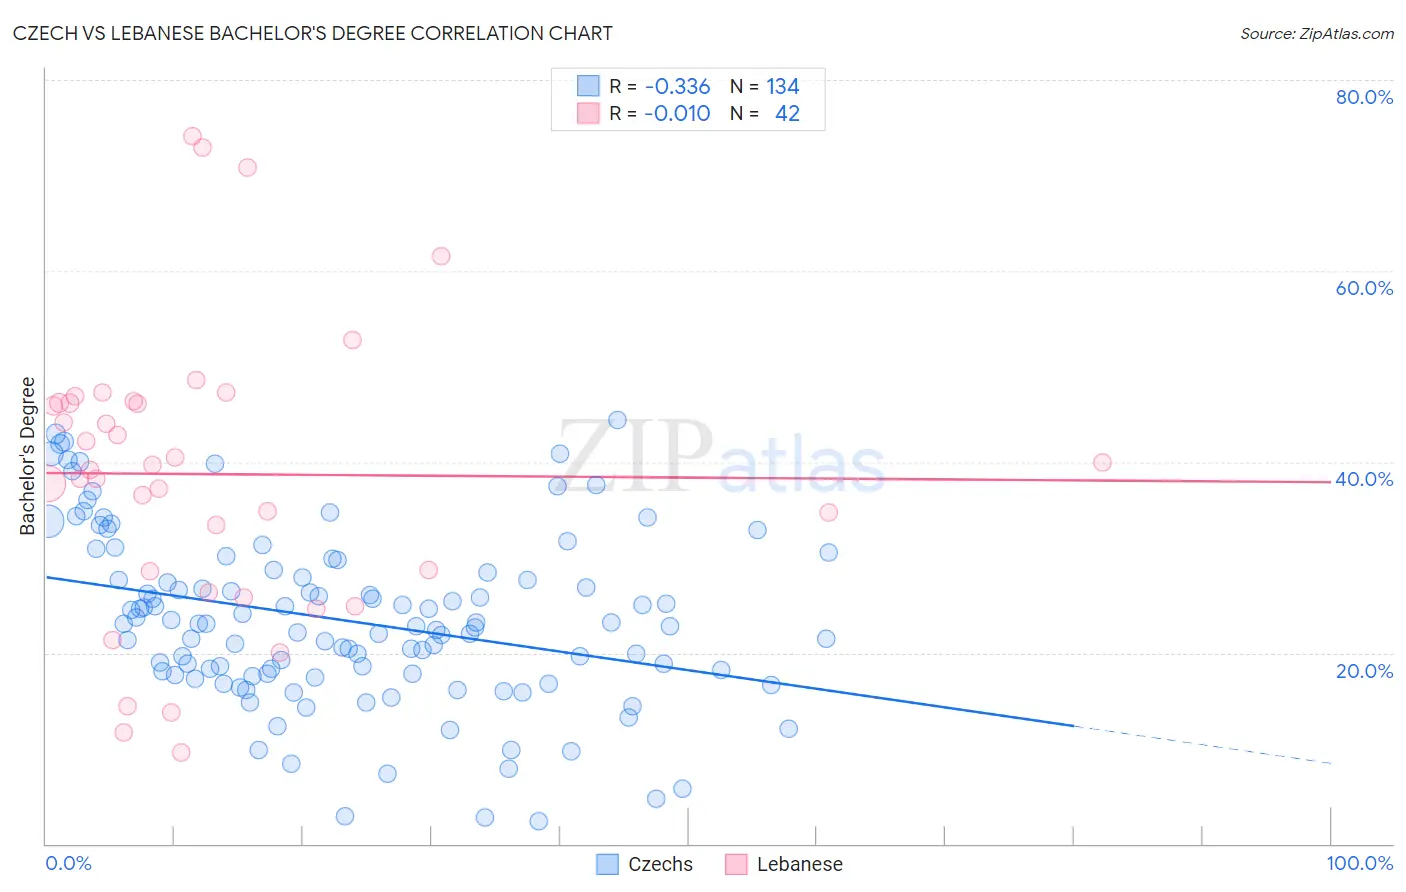
Czech vs Lebanese Bachelor's Degree Correlation Chart
The statistical analysis conducted on geographies consisting of 484,759,753 people shows a mild negative correlation between the proportion of Czechs and percentage of population with at least bachelor's degree education in the United States with a correlation coefficient (R) of -0.336 and weighted average of 38.0%. Similarly, the statistical analysis conducted on geographies consisting of 401,587,457 people shows no correlation between the proportion of Lebanese and percentage of population with at least bachelor's degree education in the United States with a correlation coefficient (R) of -0.010 and weighted average of 40.4%, a difference of 6.4%.
Bachelor's Degree Correlation Summary
| Measurement | Czech | Lebanese |
| Minimum | 2.4% | 9.6% |
| Maximum | 44.4% | 74.0% |
| Range | 42.1% | 64.5% |
| Mean | 23.4% | 38.7% |
| Median | 22.9% | 39.4% |
| Interquartile 25% (IQ1) | 17.8% | 28.6% |
| Interquartile 75% (IQ3) | 28.5% | 46.2% |
| Interquartile Range (IQR) | 10.6% | 17.6% |
| Standard Deviation (Sample) | 9.0% | 15.0% |
| Standard Deviation (Population) | 9.0% | 14.9% |
Similar Demographics by Bachelor's Degree
Demographics Similar to Czechs by Bachelor's Degree
In terms of bachelor's degree, the demographic groups most similar to Czechs are Bermudan (38.0%, a difference of 0.010%), Ghanaian (38.0%, a difference of 0.10%), Immigrants from Somalia (37.9%, a difference of 0.15%), Danish (38.1%, a difference of 0.18%), and Immigrants from Iraq (37.9%, a difference of 0.18%).
| Demographics | Rating | Rank | Bachelor's Degree |
| Peruvians | 63.4 /100 | #163 | Good 38.3% |
| Hungarians | 62.1 /100 | #164 | Good 38.3% |
| Sri Lankans | 59.1 /100 | #165 | Average 38.2% |
| Somalis | 58.6 /100 | #166 | Average 38.1% |
| Scottish | 56.6 /100 | #167 | Average 38.1% |
| Danes | 56.2 /100 | #168 | Average 38.1% |
| Ghanaians | 55.3 /100 | #169 | Average 38.0% |
| Czechs | 54.4 /100 | #170 | Average 38.0% |
| Bermudans | 54.2 /100 | #171 | Average 38.0% |
| Immigrants | Somalia | 52.8 /100 | #172 | Average 37.9% |
| Immigrants | Iraq | 52.5 /100 | #173 | Average 37.9% |
| Immigrants | Bangladesh | 50.0 /100 | #174 | Average 37.8% |
| Immigrants | Uruguay | 48.3 /100 | #175 | Average 37.8% |
| Costa Ricans | 47.6 /100 | #176 | Average 37.7% |
| Basques | 47.4 /100 | #177 | Average 37.7% |
Demographics Similar to Lebanese by Bachelor's Degree
In terms of bachelor's degree, the demographic groups most similar to Lebanese are Immigrants from Eritrea (40.4%, a difference of 0.0%), Immigrants from Albania (40.4%, a difference of 0.020%), British (40.4%, a difference of 0.040%), Immigrants from Eastern Africa (40.4%, a difference of 0.090%), and Moroccan (40.5%, a difference of 0.12%).
| Demographics | Rating | Rank | Bachelor's Degree |
| Immigrants | Uganda | 95.7 /100 | #116 | Exceptional 40.7% |
| Austrians | 95.5 /100 | #117 | Exceptional 40.6% |
| Croatians | 95.5 /100 | #118 | Exceptional 40.6% |
| Immigrants | Syria | 94.9 /100 | #119 | Exceptional 40.5% |
| Venezuelans | 94.7 /100 | #120 | Exceptional 40.5% |
| Moroccans | 94.6 /100 | #121 | Exceptional 40.5% |
| Immigrants | Albania | 94.4 /100 | #122 | Exceptional 40.4% |
| Lebanese | 94.3 /100 | #123 | Exceptional 40.4% |
| Immigrants | Eritrea | 94.3 /100 | #124 | Exceptional 40.4% |
| British | 94.2 /100 | #125 | Exceptional 40.4% |
| Immigrants | Eastern Africa | 94.1 /100 | #126 | Exceptional 40.4% |
| Immigrants | Jordan | 93.4 /100 | #127 | Exceptional 40.3% |
| Immigrants | Venezuela | 92.9 /100 | #128 | Exceptional 40.2% |
| Serbians | 92.4 /100 | #129 | Exceptional 40.1% |
| Sierra Leoneans | 92.2 /100 | #130 | Exceptional 40.1% |