Crow vs Armenian Professional Degree

COMPARE

Crow
Race
Ancestry
AfghanAfricanAlaska NativeAlaskan AthabascanAlbanianAleutAlsatianAmericanApacheArabArapahoArgentineanAssyrian/Chaldean/SyriacAustralianAustrianBahamianBangladeshiBarbadianBasqueBelgianBelizeanBermudanBhutaneseBlackfeetBolivianBrazilianBritishBritish West IndianBulgarianBurmeseCajunCambodianCanadianCape VerdeanCarpatho RusynCelticCentral AmericanCentral American IndianCherokeeCheyenneChickasawChileanChineseChippewaChoctawColombianColvilleComancheCosta RicanCreeCreekCroatianCrowCubanCypriotCzechCzechoslovakianDanishDelawareDominicanDutchDutch West IndianEastern EuropeanEcuadorianEgyptianEnglishEstonianEthiopianEuropeanFijianFilipinoFinnishFrenchFrench American IndianFrench CanadianGermanGerman RussianGhanaianGreekGuamanian/ChamorroGuatemalanGuyaneseHaitianHmongHonduranHopiHoumaHungarianIcelanderIndian (Asian)IndonesianInupiatIranianIraqiIrishIroquoisIsraeliItalianJamaicanJapaneseJordanianKenyanKiowaKoreanLaotianLatvianLebaneseLiberianLithuanianLumbeeLuxembourgerMacedonianMalaysianMalteseMarshalleseMenomineeMexicanMexican American IndianMongolianMoroccanNative HawaiianNavajoNepaleseNew ZealanderNicaraguanNigerianNorthern EuropeanNorwegianOkinawanOsageOttawaPaiutePakistaniPalestinianPanamanianParaguayanPennsylvania GermanPeruvianPimaPolishPortuguesePotawatomiPuebloPuerto RicanPuget Sound SalishRomanianRussianSalvadoranSamoanScandinavianScotch-IrishScottishSeminoleSenegaleseSerbianShoshoneSierra LeoneanSiouxSlavicSlovakSloveneSomaliSouth AfricanSouth AmericanSouth American IndianSoviet UnionSpaniardSpanishSpanish AmericanSpanish American IndianSri LankanSubsaharan AfricanSudaneseSwedishSwissSyrianTaiwaneseThaiTlingit-HaidaTohono O'OdhamTonganTrinidadian and TobagonianTsimshianTurkishU.S. Virgin IslanderUgandanUkrainianUruguayanUteVenezuelanVietnameseWelshWest IndianYakamaYaquiYugoslavianYumanYup'ikZimbabwean
Immigration
NonimmigrantsImmigrantsAfghanistanAfricaAlbaniaArgentinaArmeniaAsiaAustraliaAustriaBahamasBangladeshBarbadosBelarusBelgiumBelizeBoliviaBosnia and HerzegovinaBrazilBulgariaBurma/MyanmarCabo VerdeCambodiaCameroonCanadaCaribbeanCentral AmericaChileChinaColombiaCongoCosta RicaCroatiaCubaCzechoslovakiaDenmarkDominicaDominican RepublicEastern AfricaEastern AsiaEastern EuropeEcuadorEgyptEl SalvadorEnglandEritreaEthiopiaEuropeFijiFranceGermanyGhanaGreeceGrenadaGuatemalaGuyanaHaitiHondurasHong KongHungaryIndiaIndonesiaIranIraqIrelandIsraelItalyJamaicaJapanJordanKazakhstanKenyaKoreaKuwaitLaosLatin AmericaLatviaLebanonLiberiaLithuaniaMalaysiaMexicoMicronesiaMiddle AfricaMoldovaMoroccoNepalNetherlandsNicaraguaNigeriaNorth AmericaNorth MacedoniaNorthern AfricaNorthern EuropeNorwayOceaniaPakistanPanamaPeruPhilippinesPolandPortugalRomaniaRussiaSaudi ArabiaScotlandSenegalSerbiaSierra LeoneSingaporeSomaliaSouth AfricaSouth AmericaSouth Central AsiaSouth Eastern AsiaSouthern EuropeSpainSri LankaSt. Vincent and the GrenadinesSudanSwedenSwitzerlandSyriaTaiwanThailandTrinidad and TobagoTurkeyUgandaUkraineUruguayUzbekistanVenezuelaVietnamWest IndiesWestern AfricaWestern AsiaWestern EuropeYemenZaireZimbabweAzores
Armenian
Race
Ancestry
AfghanAfricanAlaska NativeAlaskan AthabascanAlbanianAleutAlsatianAmericanApacheArabArapahoArgentineanArmenianAssyrian/Chaldean/SyriacAustralianAustrianBahamianBangladeshiBarbadianBasqueBelgianBelizeanBermudanBhutaneseBlackfeetBolivianBrazilianBritishBritish West IndianBulgarianBurmeseCajunCambodianCanadianCape VerdeanCarpatho RusynCelticCentral AmericanCentral American IndianCherokeeCheyenneChickasawChileanChineseChippewaChoctawColombianColvilleComancheCosta RicanCreeCreekCroatianCubanCypriotCzechCzechoslovakianDanishDelawareDominicanDutchDutch West IndianEastern EuropeanEcuadorianEgyptianEnglishEstonianEthiopianEuropeanFijianFilipinoFinnishFrenchFrench American IndianFrench CanadianGermanGerman RussianGhanaianGreekGuamanian/ChamorroGuatemalanGuyaneseHaitianHmongHonduranHopiHoumaHungarianIcelanderIndian (Asian)IndonesianInupiatIranianIraqiIrishIroquoisIsraeliItalianJamaicanJapaneseJordanianKenyanKiowaKoreanLaotianLatvianLebaneseLiberianLithuanianLumbeeLuxembourgerMacedonianMalaysianMalteseMarshalleseMenomineeMexicanMexican American IndianMongolianMoroccanNative HawaiianNavajoNepaleseNew ZealanderNicaraguanNigerianNorthern EuropeanNorwegianOkinawanOsageOttawaPaiutePakistaniPalestinianPanamanianParaguayanPennsylvania GermanPeruvianPimaPolishPortuguesePotawatomiPuebloPuerto RicanPuget Sound SalishRomanianRussianSalvadoranSamoanScandinavianScotch-IrishScottishSeminoleSenegaleseSerbianShoshoneSierra LeoneanSiouxSlavicSlovakSloveneSomaliSouth AfricanSouth AmericanSouth American IndianSoviet UnionSpaniardSpanishSpanish AmericanSpanish American IndianSri LankanSubsaharan AfricanSudaneseSwedishSwissSyrianTaiwaneseThaiTlingit-HaidaTohono O'OdhamTonganTrinidadian and TobagonianTsimshianTurkishU.S. Virgin IslanderUgandanUkrainianUruguayanUteVenezuelanVietnameseWelshWest IndianYakamaYaquiYugoslavianYumanYup'ikZimbabwean
Immigration
NonimmigrantsImmigrantsAfghanistanAfricaAlbaniaArgentinaArmeniaAsiaAustraliaAustriaBahamasBangladeshBarbadosBelarusBelgiumBelizeBoliviaBosnia and HerzegovinaBrazilBulgariaBurma/MyanmarCabo VerdeCambodiaCameroonCanadaCaribbeanCentral AmericaChileChinaColombiaCongoCosta RicaCroatiaCubaCzechoslovakiaDenmarkDominicaDominican RepublicEastern AfricaEastern AsiaEastern EuropeEcuadorEgyptEl SalvadorEnglandEritreaEthiopiaEuropeFijiFranceGermanyGhanaGreeceGrenadaGuatemalaGuyanaHaitiHondurasHong KongHungaryIndiaIndonesiaIranIraqIrelandIsraelItalyJamaicaJapanJordanKazakhstanKenyaKoreaKuwaitLaosLatin AmericaLatviaLebanonLiberiaLithuaniaMalaysiaMexicoMicronesiaMiddle AfricaMoldovaMoroccoNepalNetherlandsNicaraguaNigeriaNorth AmericaNorth MacedoniaNorthern AfricaNorthern EuropeNorwayOceaniaPakistanPanamaPeruPhilippinesPolandPortugalRomaniaRussiaSaudi ArabiaScotlandSenegalSerbiaSierra LeoneSingaporeSomaliaSouth AfricaSouth AmericaSouth Central AsiaSouth Eastern AsiaSouthern EuropeSpainSri LankaSt. Vincent and the GrenadinesSudanSwedenSwitzerlandSyriaTaiwanThailandTrinidad and TobagoTurkeyUgandaUkraineUruguayUzbekistanVenezuelaVietnamWest IndiesWestern AfricaWestern AsiaWestern EuropeYemenZaireZimbabweAzores
Professional Degree
Income
Poverty
Unemployment
Labor Participation
Family Structure
Vehicle Availability
Education Level
Disability

Professional Degree Comparison

Crow

Armenians

Tragic
Exceptional
3.2%
PROFESSIONAL DEGREE
0.0/ 100
METRIC RATING
324th/ 347
METRIC RANK
5.3%
PROFESSIONAL DEGREE
99.7/ 100
METRIC RATING
78th/ 347
METRIC RANK

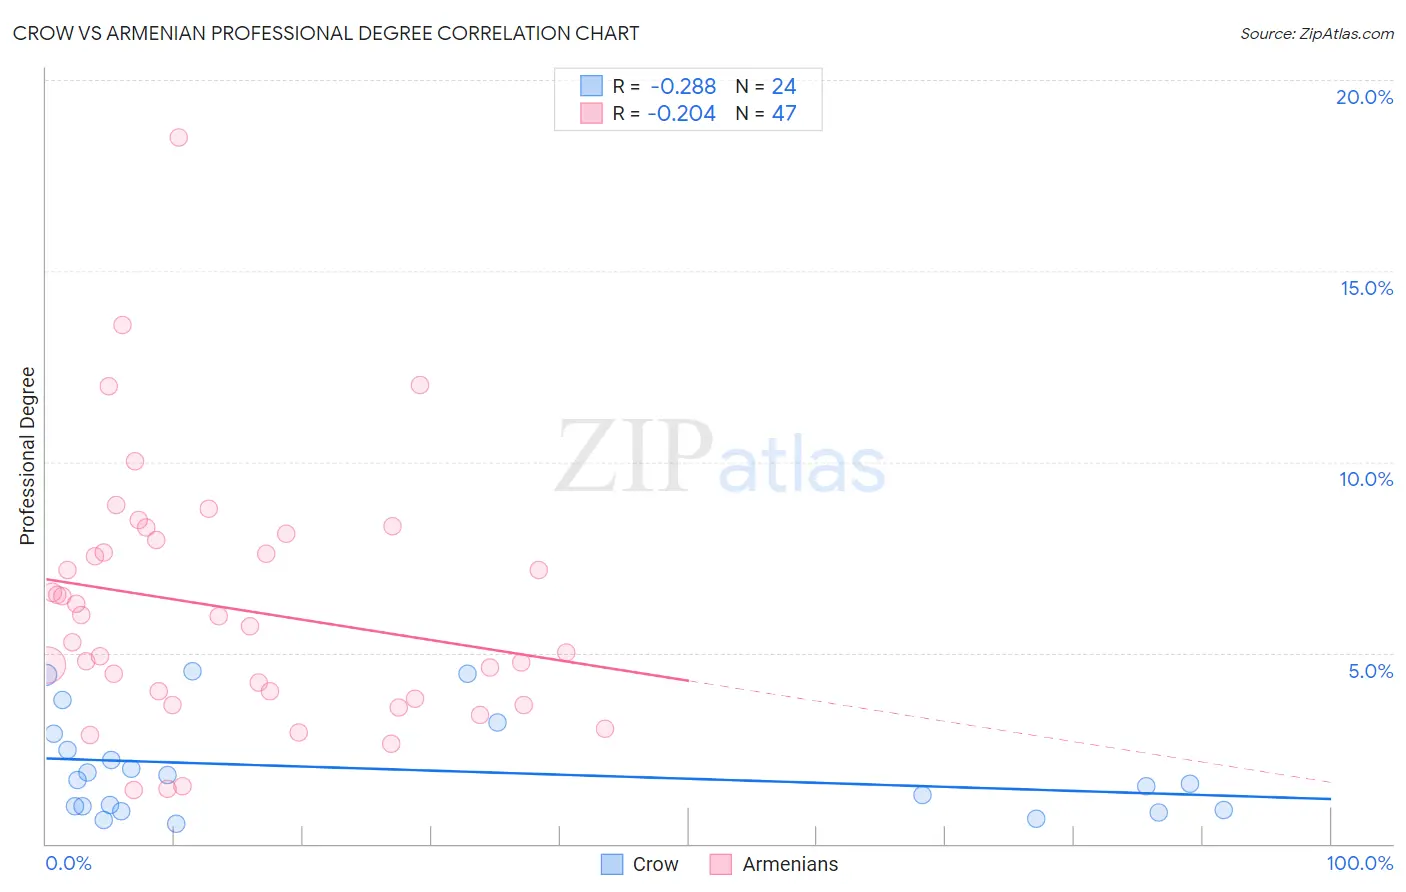
Crow vs Armenian Professional Degree Correlation Chart

The statistical analysis conducted on geographies consisting of 59,107,625 people shows a weak negative correlation between the proportion of Crow and percentage of population with at least professional degree education in the United States with a correlation coefficient (R) of -0.288 and weighted average of 3.2%. Similarly, the statistical analysis conducted on geographies consisting of 310,624,629 people shows a weak negative correlation between the proportion of Armenians and percentage of population with at least professional degree education in the United States with a correlation coefficient (R) of -0.204 and weighted average of 5.3%, a difference of 69.1%.
Crow vs Armenian Professional Degree

Professional Degree Correlation Summary

MeasurementCrowArmenian
Minimum0.53%1.4%
Maximum4.5%18.5%
Range4.0%17.1%
Mean2.0%6.2%
Median1.6%5.7%
Interquartile 25% (IQ1)0.93%3.8%
Interquartile 75% (IQ3)2.7%8.0%
Interquartile Range (IQR)1.7%4.1%
Standard Deviation (Sample)1.3%3.3%
Standard Deviation (Population)1.3%3.3%

Similar Demographics by Professional Degree

Demographics Similar to Crow by Professional Degree

In terms of professional degree, the demographic groups most similar to Crow are Yaqui (3.2%, a difference of 0.060%), Inupiat (3.2%, a difference of 0.27%), Hispanic or Latino (3.2%, a difference of 0.35%), Tsimshian (3.2%, a difference of 0.72%), and Seminole (3.2%, a difference of 1.1%).
DemographicsRating | RankProfessional Degree
Nepalese
0.1
/100
|
#317
Tragic
3.2%
Immigrants | Micronesia
0.1
/100
|
#318
Tragic
3.2%
Choctaw
0.1
/100
|
#319
Tragic
3.2%
Seminole
0.1
/100
|
#320
Tragic
3.2%
Tsimshian
0.0
/100
|
#321
Tragic
3.2%
Hispanics or Latinos
0.0
/100
|
#322
Tragic
3.2%
Inupiat
0.0
/100
|
#323
Tragic
3.2%
Crow
0.0
/100
|
#324
Tragic
3.2%
Yaqui
0.0
/100
|
#325
Tragic
3.2%
Menominee
0.0
/100
|
#326
Tragic
3.1%
Dutch West Indians
0.0
/100
|
#327
Tragic
3.1%
Creek
0.0
/100
|
#328
Tragic
3.1%
Bangladeshis
0.0
/100
|
#329
Tragic
3.1%
Immigrants | Cabo Verde
0.0
/100
|
#330
Tragic
3.1%
Kiowa
0.0
/100
|
#331
Tragic
3.1%

Demographics Similar to Armenians by Professional Degree

In terms of professional degree, the demographic groups most similar to Armenians are Immigrants from Ethiopia (5.3%, a difference of 0.050%), Immigrants from Canada (5.3%, a difference of 0.090%), Immigrants from Indonesia (5.3%, a difference of 0.17%), Immigrants from North America (5.3%, a difference of 0.17%), and Ethiopian (5.4%, a difference of 0.30%).
DemographicsRating | RankProfessional Degree
Immigrants | Western Asia
99.8
/100
|
#71
Exceptional
5.4%
Lithuanians
99.8
/100
|
#72
Exceptional
5.4%
Immigrants | Romania
99.8
/100
|
#73
Exceptional
5.4%
Ethiopians
99.7
/100
|
#74
Exceptional
5.4%
Immigrants | Indonesia
99.7
/100
|
#75
Exceptional
5.3%
Immigrants | Canada
99.7
/100
|
#76
Exceptional
5.3%
Immigrants | Ethiopia
99.7
/100
|
#77
Exceptional
5.3%
Armenians
99.7
/100
|
#78
Exceptional
5.3%
Immigrants | North America
99.7
/100
|
#79
Exceptional
5.3%
Immigrants | England
99.6
/100
|
#80
Exceptional
5.3%
Immigrants | Brazil
99.6
/100
|
#81
Exceptional
5.3%
Romanians
99.6
/100
|
#82
Exceptional
5.3%
Carpatho Rusyns
99.6
/100
|
#83
Exceptional
5.3%
Immigrants | Croatia
99.6
/100
|
#84
Exceptional
5.3%
Immigrants | Zimbabwe
99.6
/100
|
#85
Exceptional
5.3%