Crow vs Armenian Kindergarten

COMPARE

Crow
Race
Ancestry
AfghanAfricanAlaska NativeAlaskan AthabascanAlbanianAleutAlsatianAmericanApacheArabArapahoArgentineanAssyrian/Chaldean/SyriacAustralianAustrianBahamianBangladeshiBarbadianBasqueBelgianBelizeanBermudanBhutaneseBlackfeetBolivianBrazilianBritishBritish West IndianBulgarianBurmeseCajunCambodianCanadianCape VerdeanCarpatho RusynCelticCentral AmericanCentral American IndianCherokeeCheyenneChickasawChileanChineseChippewaChoctawColombianColvilleComancheCosta RicanCreeCreekCroatianCrowCubanCypriotCzechCzechoslovakianDanishDelawareDominicanDutchDutch West IndianEastern EuropeanEcuadorianEgyptianEnglishEstonianEthiopianEuropeanFijianFilipinoFinnishFrenchFrench American IndianFrench CanadianGermanGerman RussianGhanaianGreekGuamanian/ChamorroGuatemalanGuyaneseHaitianHmongHonduranHopiHoumaHungarianIcelanderIndian (Asian)IndonesianInupiatIranianIraqiIrishIroquoisIsraeliItalianJamaicanJapaneseJordanianKenyanKiowaKoreanLaotianLatvianLebaneseLiberianLithuanianLumbeeLuxembourgerMacedonianMalaysianMalteseMarshalleseMenomineeMexicanMexican American IndianMongolianMoroccanNative HawaiianNavajoNepaleseNew ZealanderNicaraguanNigerianNorthern EuropeanNorwegianOkinawanOsageOttawaPaiutePakistaniPalestinianPanamanianParaguayanPennsylvania GermanPeruvianPimaPolishPortuguesePotawatomiPuebloPuerto RicanPuget Sound SalishRomanianRussianSalvadoranSamoanScandinavianScotch-IrishScottishSeminoleSenegaleseSerbianShoshoneSierra LeoneanSiouxSlavicSlovakSloveneSomaliSouth AfricanSouth AmericanSouth American IndianSoviet UnionSpaniardSpanishSpanish AmericanSpanish American IndianSri LankanSubsaharan AfricanSudaneseSwedishSwissSyrianTaiwaneseThaiTlingit-HaidaTohono O'OdhamTonganTrinidadian and TobagonianTsimshianTurkishU.S. Virgin IslanderUgandanUkrainianUruguayanUteVenezuelanVietnameseWelshWest IndianYakamaYaquiYugoslavianYumanYup'ikZimbabwean
Immigration
NonimmigrantsImmigrantsAfghanistanAfricaAlbaniaArgentinaArmeniaAsiaAustraliaAustriaBahamasBangladeshBarbadosBelarusBelgiumBelizeBoliviaBosnia and HerzegovinaBrazilBulgariaBurma/MyanmarCabo VerdeCambodiaCameroonCanadaCaribbeanCentral AmericaChileChinaColombiaCongoCosta RicaCroatiaCubaCzechoslovakiaDenmarkDominicaDominican RepublicEastern AfricaEastern AsiaEastern EuropeEcuadorEgyptEl SalvadorEnglandEritreaEthiopiaEuropeFijiFranceGermanyGhanaGreeceGrenadaGuatemalaGuyanaHaitiHondurasHong KongHungaryIndiaIndonesiaIranIraqIrelandIsraelItalyJamaicaJapanJordanKazakhstanKenyaKoreaKuwaitLaosLatin AmericaLatviaLebanonLiberiaLithuaniaMalaysiaMexicoMicronesiaMiddle AfricaMoldovaMoroccoNepalNetherlandsNicaraguaNigeriaNorth AmericaNorth MacedoniaNorthern AfricaNorthern EuropeNorwayOceaniaPakistanPanamaPeruPhilippinesPolandPortugalRomaniaRussiaSaudi ArabiaScotlandSenegalSerbiaSierra LeoneSingaporeSomaliaSouth AfricaSouth AmericaSouth Central AsiaSouth Eastern AsiaSouthern EuropeSpainSri LankaSt. Vincent and the GrenadinesSudanSwedenSwitzerlandSyriaTaiwanThailandTrinidad and TobagoTurkeyUgandaUkraineUruguayUzbekistanVenezuelaVietnamWest IndiesWestern AfricaWestern AsiaWestern EuropeYemenZaireZimbabweAzores
Armenian
Race
Ancestry
AfghanAfricanAlaska NativeAlaskan AthabascanAlbanianAleutAlsatianAmericanApacheArabArapahoArgentineanArmenianAssyrian/Chaldean/SyriacAustralianAustrianBahamianBangladeshiBarbadianBasqueBelgianBelizeanBermudanBhutaneseBlackfeetBolivianBrazilianBritishBritish West IndianBulgarianBurmeseCajunCambodianCanadianCape VerdeanCarpatho RusynCelticCentral AmericanCentral American IndianCherokeeCheyenneChickasawChileanChineseChippewaChoctawColombianColvilleComancheCosta RicanCreeCreekCroatianCubanCypriotCzechCzechoslovakianDanishDelawareDominicanDutchDutch West IndianEastern EuropeanEcuadorianEgyptianEnglishEstonianEthiopianEuropeanFijianFilipinoFinnishFrenchFrench American IndianFrench CanadianGermanGerman RussianGhanaianGreekGuamanian/ChamorroGuatemalanGuyaneseHaitianHmongHonduranHopiHoumaHungarianIcelanderIndian (Asian)IndonesianInupiatIranianIraqiIrishIroquoisIsraeliItalianJamaicanJapaneseJordanianKenyanKiowaKoreanLaotianLatvianLebaneseLiberianLithuanianLumbeeLuxembourgerMacedonianMalaysianMalteseMarshalleseMenomineeMexicanMexican American IndianMongolianMoroccanNative HawaiianNavajoNepaleseNew ZealanderNicaraguanNigerianNorthern EuropeanNorwegianOkinawanOsageOttawaPaiutePakistaniPalestinianPanamanianParaguayanPennsylvania GermanPeruvianPimaPolishPortuguesePotawatomiPuebloPuerto RicanPuget Sound SalishRomanianRussianSalvadoranSamoanScandinavianScotch-IrishScottishSeminoleSenegaleseSerbianShoshoneSierra LeoneanSiouxSlavicSlovakSloveneSomaliSouth AfricanSouth AmericanSouth American IndianSoviet UnionSpaniardSpanishSpanish AmericanSpanish American IndianSri LankanSubsaharan AfricanSudaneseSwedishSwissSyrianTaiwaneseThaiTlingit-HaidaTohono O'OdhamTonganTrinidadian and TobagonianTsimshianTurkishU.S. Virgin IslanderUgandanUkrainianUruguayanUteVenezuelanVietnameseWelshWest IndianYakamaYaquiYugoslavianYumanYup'ikZimbabwean
Immigration
NonimmigrantsImmigrantsAfghanistanAfricaAlbaniaArgentinaArmeniaAsiaAustraliaAustriaBahamasBangladeshBarbadosBelarusBelgiumBelizeBoliviaBosnia and HerzegovinaBrazilBulgariaBurma/MyanmarCabo VerdeCambodiaCameroonCanadaCaribbeanCentral AmericaChileChinaColombiaCongoCosta RicaCroatiaCubaCzechoslovakiaDenmarkDominicaDominican RepublicEastern AfricaEastern AsiaEastern EuropeEcuadorEgyptEl SalvadorEnglandEritreaEthiopiaEuropeFijiFranceGermanyGhanaGreeceGrenadaGuatemalaGuyanaHaitiHondurasHong KongHungaryIndiaIndonesiaIranIraqIrelandIsraelItalyJamaicaJapanJordanKazakhstanKenyaKoreaKuwaitLaosLatin AmericaLatviaLebanonLiberiaLithuaniaMalaysiaMexicoMicronesiaMiddle AfricaMoldovaMoroccoNepalNetherlandsNicaraguaNigeriaNorth AmericaNorth MacedoniaNorthern AfricaNorthern EuropeNorwayOceaniaPakistanPanamaPeruPhilippinesPolandPortugalRomaniaRussiaSaudi ArabiaScotlandSenegalSerbiaSierra LeoneSingaporeSomaliaSouth AfricaSouth AmericaSouth Central AsiaSouth Eastern AsiaSouthern EuropeSpainSri LankaSt. Vincent and the GrenadinesSudanSwedenSwitzerlandSyriaTaiwanThailandTrinidad and TobagoTurkeyUgandaUkraineUruguayUzbekistanVenezuelaVietnamWest IndiesWestern AfricaWestern AsiaWestern EuropeYemenZaireZimbabweAzores
Kindergarten
Income
Poverty
Unemployment
Labor Participation
Family Structure
Vehicle Availability
Education Level
Disability

Kindergarten Comparison

Crow

Armenians

Exceptional
Tragic
99.7%
KINDERGARTEN
100.0/ 100
METRIC RATING
1st/ 347
METRIC RANK
97.6%
KINDERGARTEN
0.5/ 100
METRIC RATING
259th/ 347
METRIC RANK

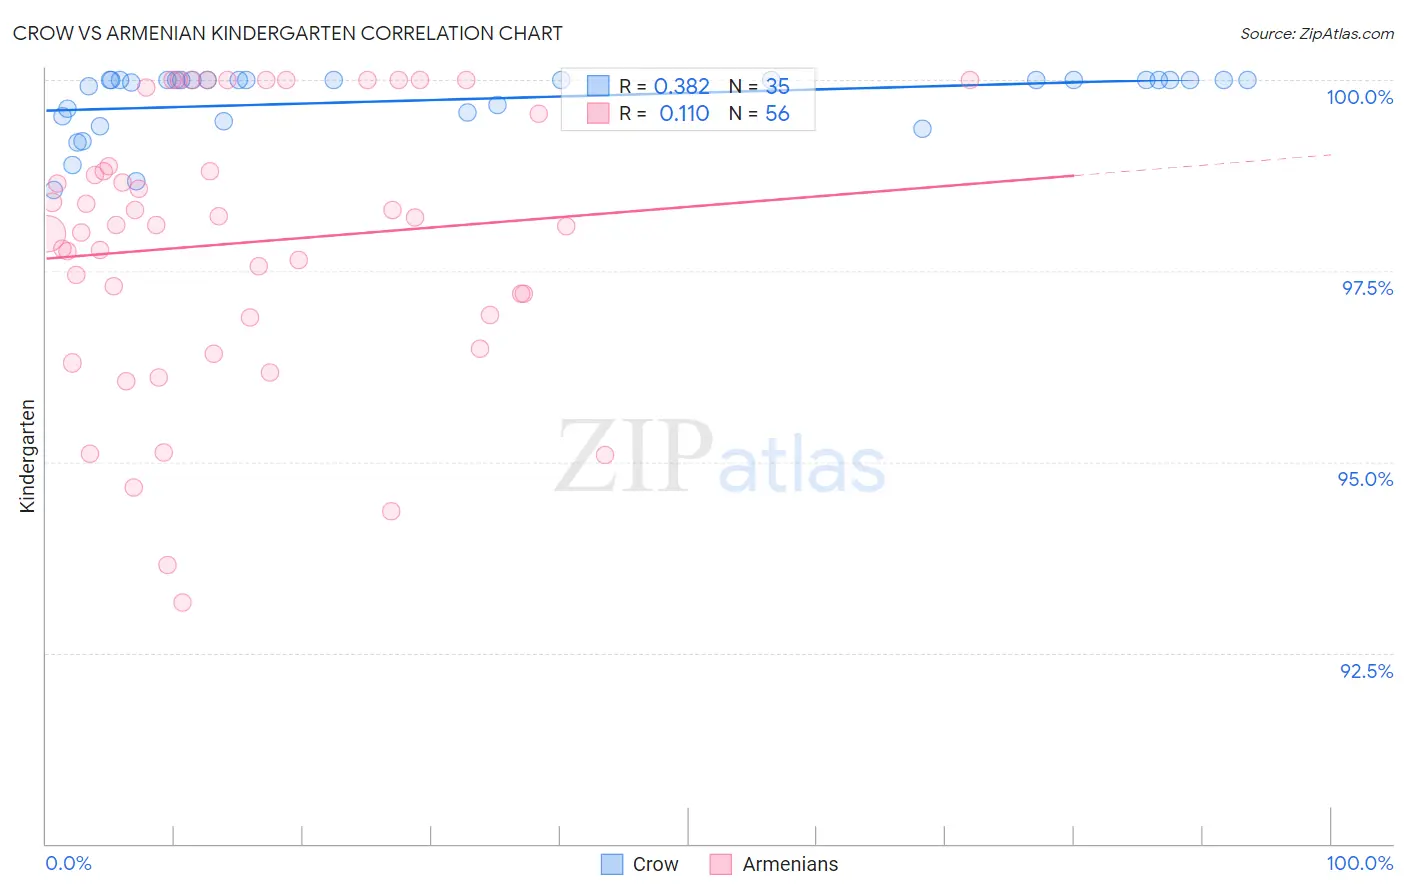
Crow vs Armenian Kindergarten Correlation Chart

The statistical analysis conducted on geographies consisting of 665,246 people shows a mild positive correlation between the proportion of Crow and percentage of population with at least kindergarten education in the United States with a correlation coefficient (R) of 0.382 and weighted average of 99.7%. Similarly, the statistical analysis conducted on geographies consisting of 310,954,660 people shows a poor positive correlation between the proportion of Armenians and percentage of population with at least kindergarten education in the United States with a correlation coefficient (R) of 0.110 and weighted average of 97.6%, a difference of 2.1%.
Crow vs Armenian Kindergarten

Kindergarten Correlation Summary

MeasurementCrowArmenian
Minimum98.6%93.2%
Maximum100.0%100.0%
Range1.4%6.8%
Mean99.7%97.9%
Median100.0%98.1%
Interquartile 25% (IQ1)99.5%96.9%
Interquartile 75% (IQ3)100.0%99.2%
Interquartile Range (IQR)0.48%2.3%
Standard Deviation (Sample)0.41%1.8%
Standard Deviation (Population)0.41%1.8%

Similar Demographics by Kindergarten

Demographics Similar to Crow by Kindergarten

In terms of kindergarten, the demographic groups most similar to Crow are Yup'ik (99.2%, a difference of 0.45%), Inupiat (98.9%, a difference of 0.78%), Welsh (98.9%, a difference of 0.79%), Tsimshian (98.8%, a difference of 0.81%), and Alaskan Athabascan (98.8%, a difference of 0.88%).
DemographicsRating | RankKindergarten
Crow
100.0
/100
|
#1
Exceptional
99.7%
Yup'ik
100.0
/100
|
#2
Exceptional
99.2%
Inupiat
100.0
/100
|
#3
Exceptional
98.9%
Welsh
100.0
/100
|
#4
Exceptional
98.9%
Tsimshian
100.0
/100
|
#5
Exceptional
98.8%
Alaskan Athabascans
100.0
/100
|
#6
Exceptional
98.8%
Alaska Natives
100.0
/100
|
#7
Exceptional
98.7%
Norwegians
100.0
/100
|
#8
Exceptional
98.7%
Tlingit-Haida
100.0
/100
|
#9
Exceptional
98.7%
Slovaks
100.0
/100
|
#10
Exceptional
98.7%
Germans
100.0
/100
|
#11
Exceptional
98.7%
Slovenes
100.0
/100
|
#12
Exceptional
98.7%
Carpatho Rusyns
100.0
/100
|
#13
Exceptional
98.7%
English
100.0
/100
|
#14
Exceptional
98.7%
Swedes
100.0
/100
|
#15
Exceptional
98.7%

Demographics Similar to Armenians by Kindergarten

In terms of kindergarten, the demographic groups most similar to Armenians are Jamaican (97.6%, a difference of 0.010%), Fijian (97.5%, a difference of 0.010%), Taiwanese (97.5%, a difference of 0.010%), Immigrants from Ethiopia (97.5%, a difference of 0.010%), and Immigrants from South America (97.5%, a difference of 0.010%).
DemographicsRating | RankKindergarten
Immigrants | Iraq
0.9
/100
|
#252
Tragic
97.6%
Immigrants | Africa
0.8
/100
|
#253
Tragic
97.6%
Immigrants | Asia
0.8
/100
|
#254
Tragic
97.6%
Immigrants | Congo
0.8
/100
|
#255
Tragic
97.6%
Yaqui
0.7
/100
|
#256
Tragic
97.6%
Immigrants | Colombia
0.6
/100
|
#257
Tragic
97.6%
Jamaicans
0.6
/100
|
#258
Tragic
97.6%
Armenians
0.5
/100
|
#259
Tragic
97.6%
Fijians
0.5
/100
|
#260
Tragic
97.5%
Taiwanese
0.4
/100
|
#261
Tragic
97.5%
Immigrants | Ethiopia
0.4
/100
|
#262
Tragic
97.5%
Immigrants | South America
0.4
/100
|
#263
Tragic
97.5%
Assyrians/Chaldeans/Syriacs
0.4
/100
|
#264
Tragic
97.5%
Cubans
0.3
/100
|
#265
Tragic
97.5%
Immigrants | Sierra Leone
0.3
/100
|
#266
Tragic
97.5%