Comanche vs Choctaw 2nd Grade
COMPARE
Comanche
Choctaw
2nd Grade
2nd Grade Comparison
Comanche
Choctaw
97.9%
2ND GRADE
62.8/ 100
METRIC RATING
159th/ 347
METRIC RANK
98.2%
2ND GRADE
98.3/ 100
METRIC RATING
97th/ 347
METRIC RANK
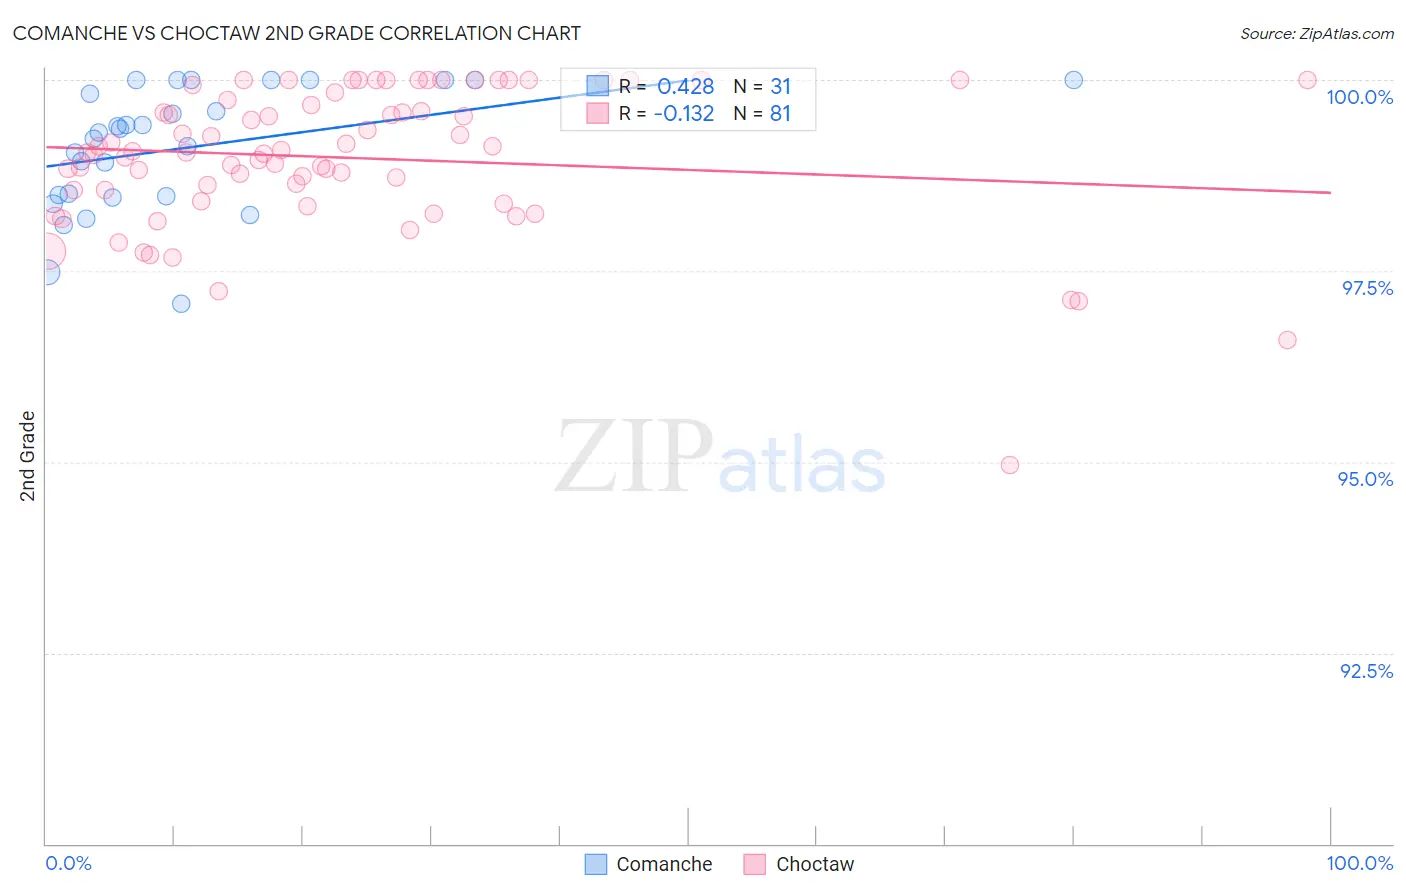
Comanche vs Choctaw 2nd Grade Correlation Chart
The statistical analysis conducted on geographies consisting of 109,786,530 people shows a moderate positive correlation between the proportion of Comanche and percentage of population with at least 2nd grade education in the United States with a correlation coefficient (R) of 0.428 and weighted average of 97.9%. Similarly, the statistical analysis conducted on geographies consisting of 269,742,875 people shows a poor negative correlation between the proportion of Choctaw and percentage of population with at least 2nd grade education in the United States with a correlation coefficient (R) of -0.132 and weighted average of 98.2%, a difference of 0.28%.
2nd Grade Correlation Summary
| Measurement | Comanche | Choctaw |
| Minimum | 97.1% | 95.0% |
| Maximum | 100.0% | 100.0% |
| Range | 2.9% | 5.0% |
| Mean | 99.1% | 99.0% |
| Median | 99.3% | 99.1% |
| Interquartile 25% (IQ1) | 98.5% | 98.5% |
| Interquartile 75% (IQ3) | 100.0% | 99.8% |
| Interquartile Range (IQR) | 1.5% | 1.3% |
| Standard Deviation (Sample) | 0.80% | 0.94% |
| Standard Deviation (Population) | 0.79% | 0.93% |
Similar Demographics by 2nd Grade
Demographics Similar to Comanche by 2nd Grade
In terms of 2nd grade, the demographic groups most similar to Comanche are Dutch West Indian (97.9%, a difference of 0.0%), Venezuelan (97.9%, a difference of 0.0%), Immigrants from Iran (97.9%, a difference of 0.0%), French American Indian (97.9%, a difference of 0.010%), and Immigrants from Eastern Europe (97.9%, a difference of 0.010%).
| Demographics | Rating | Rank | 2nd Grade |
| Immigrants | North Macedonia | 68.5 /100 | #152 | Good 97.9% |
| Immigrants | South Central Asia | 68.3 /100 | #153 | Good 97.9% |
| Marshallese | 67.7 /100 | #154 | Good 97.9% |
| French American Indians | 64.3 /100 | #155 | Good 97.9% |
| Dutch West Indians | 63.8 /100 | #156 | Good 97.9% |
| Venezuelans | 63.3 /100 | #157 | Good 97.9% |
| Immigrants | Iran | 62.8 /100 | #158 | Good 97.9% |
| Comanche | 62.8 /100 | #159 | Good 97.9% |
| Immigrants | Eastern Europe | 61.1 /100 | #160 | Good 97.9% |
| Immigrants | Russia | 60.3 /100 | #161 | Good 97.9% |
| Immigrants | Italy | 60.2 /100 | #162 | Good 97.9% |
| Bermudans | 59.4 /100 | #163 | Average 97.9% |
| Ugandans | 56.6 /100 | #164 | Average 97.9% |
| Spanish Americans | 56.4 /100 | #165 | Average 97.9% |
| Immigrants | Jordan | 56.3 /100 | #166 | Average 97.9% |
Demographics Similar to Choctaw by 2nd Grade
In terms of 2nd grade, the demographic groups most similar to Choctaw are Nonimmigrants (98.2%, a difference of 0.0%), Cypriot (98.2%, a difference of 0.010%), Immigrants from Ireland (98.2%, a difference of 0.010%), Romanian (98.2%, a difference of 0.010%), and Puget Sound Salish (98.2%, a difference of 0.010%).
| Demographics | Rating | Rank | 2nd Grade |
| Zimbabweans | 98.8 /100 | #90 | Exceptional 98.2% |
| Immigrants | Western Europe | 98.8 /100 | #91 | Exceptional 98.2% |
| Immigrants | South Africa | 98.8 /100 | #92 | Exceptional 98.2% |
| Immigrants | India | 98.8 /100 | #93 | Exceptional 98.2% |
| Immigrants | Germany | 98.6 /100 | #94 | Exceptional 98.2% |
| South Africans | 98.6 /100 | #95 | Exceptional 98.2% |
| Cypriots | 98.4 /100 | #96 | Exceptional 98.2% |
| Choctaw | 98.3 /100 | #97 | Exceptional 98.2% |
| Immigrants | Nonimmigrants | 98.3 /100 | #98 | Exceptional 98.2% |
| Immigrants | Ireland | 98.0 /100 | #99 | Exceptional 98.2% |
| Romanians | 98.0 /100 | #100 | Exceptional 98.2% |
| Puget Sound Salish | 98.0 /100 | #101 | Exceptional 98.2% |
| Cree | 98.0 /100 | #102 | Exceptional 98.2% |
| Pima | 97.6 /100 | #103 | Exceptional 98.2% |
| Turks | 97.6 /100 | #104 | Exceptional 98.2% |