Chinese vs Sierra Leonean Doctorate Degree

COMPARE

Chinese
Race
Ancestry
AfghanAfricanAlaska NativeAlaskan AthabascanAlbanianAleutAlsatianAmericanApacheArabArapahoArgentineanArmenianAssyrian/Chaldean/SyriacAustralianAustrianBahamianBangladeshiBarbadianBasqueBelgianBelizeanBermudanBhutaneseBlackfeetBolivianBrazilianBritishBritish West IndianBulgarianBurmeseCajunCambodianCanadianCape VerdeanCarpatho RusynCelticCentral AmericanCentral American IndianCherokeeCheyenneChickasawChileanChineseChippewaChoctawColombianColvilleComancheCosta RicanCreeCreekCroatianCrowCubanCypriotCzechCzechoslovakianDanishDelawareDominicanDutchDutch West IndianEastern EuropeanEcuadorianEgyptianEnglishEstonianEthiopianEuropeanFijianFilipinoFinnishFrenchFrench American IndianFrench CanadianGermanGerman RussianGhanaianGreekGuamanian/ChamorroGuatemalanGuyaneseHaitianHmongHonduranHopiHoumaHungarianIcelanderIndian (Asian)IndonesianInupiatIranianIraqiIrishIroquoisIsraeliItalianJamaicanJapaneseJordanianKenyanKiowaKoreanLaotianLatvianLebaneseLiberianLithuanianLumbeeLuxembourgerMacedonianMalaysianMalteseMarshalleseMenomineeMexicanMexican American IndianMongolianMoroccanNative HawaiianNavajoNepaleseNew ZealanderNicaraguanNigerianNorthern EuropeanNorwegianOkinawanOsageOttawaPaiutePakistaniPalestinianPanamanianParaguayanPennsylvania GermanPeruvianPimaPolishPortuguesePotawatomiPuebloPuerto RicanPuget Sound SalishRomanianRussianSalvadoranSamoanScandinavianScotch-IrishScottishSeminoleSenegaleseSerbianShoshoneSiouxSlavicSlovakSloveneSomaliSouth AfricanSouth AmericanSouth American IndianSoviet UnionSpaniardSpanishSpanish AmericanSpanish American IndianSri LankanSubsaharan AfricanSudaneseSwedishSwissSyrianTaiwaneseThaiTlingit-HaidaTohono O'OdhamTonganTrinidadian and TobagonianTsimshianTurkishU.S. Virgin IslanderUgandanUkrainianUruguayanUteVenezuelanVietnameseWelshWest IndianYakamaYaquiYugoslavianYumanYup'ikZimbabwean
Immigration
NonimmigrantsImmigrantsAfghanistanAfricaAlbaniaArgentinaArmeniaAsiaAustraliaAustriaBahamasBangladeshBarbadosBelarusBelgiumBelizeBoliviaBosnia and HerzegovinaBrazilBulgariaBurma/MyanmarCabo VerdeCambodiaCameroonCanadaCaribbeanCentral AmericaChileChinaColombiaCongoCosta RicaCroatiaCubaCzechoslovakiaDenmarkDominicaDominican RepublicEastern AfricaEastern AsiaEastern EuropeEcuadorEgyptEl SalvadorEnglandEritreaEthiopiaEuropeFijiFranceGermanyGhanaGreeceGrenadaGuatemalaGuyanaHaitiHondurasHong KongHungaryIndiaIndonesiaIranIraqIrelandIsraelItalyJamaicaJapanJordanKazakhstanKenyaKoreaKuwaitLaosLatin AmericaLatviaLebanonLiberiaLithuaniaMalaysiaMexicoMicronesiaMiddle AfricaMoldovaMoroccoNepalNetherlandsNicaraguaNigeriaNorth AmericaNorth MacedoniaNorthern AfricaNorthern EuropeNorwayOceaniaPakistanPanamaPeruPhilippinesPolandPortugalRomaniaRussiaSaudi ArabiaScotlandSenegalSerbiaSierra LeoneSingaporeSomaliaSouth AfricaSouth AmericaSouth Central AsiaSouth Eastern AsiaSouthern EuropeSpainSri LankaSt. Vincent and the GrenadinesSudanSwedenSwitzerlandSyriaTaiwanThailandTrinidad and TobagoTurkeyUgandaUkraineUruguayUzbekistanVenezuelaVietnamWest IndiesWestern AfricaWestern AsiaWestern EuropeYemenZaireZimbabweAzores
Sierra Leonean
Race
Ancestry
AfghanAfricanAlaska NativeAlaskan AthabascanAlbanianAleutAlsatianAmericanApacheArabArapahoArgentineanArmenianAssyrian/Chaldean/SyriacAustralianAustrianBahamianBangladeshiBarbadianBasqueBelgianBelizeanBermudanBhutaneseBlackfeetBolivianBrazilianBritishBritish West IndianBulgarianBurmeseCajunCambodianCanadianCape VerdeanCarpatho RusynCelticCentral AmericanCentral American IndianCherokeeCheyenneChickasawChileanChippewaChoctawColombianColvilleComancheCosta RicanCreeCreekCroatianCrowCubanCypriotCzechCzechoslovakianDanishDelawareDominicanDutchDutch West IndianEastern EuropeanEcuadorianEgyptianEnglishEstonianEthiopianEuropeanFijianFilipinoFinnishFrenchFrench American IndianFrench CanadianGermanGerman RussianGhanaianGreekGuamanian/ChamorroGuatemalanGuyaneseHaitianHmongHonduranHopiHoumaHungarianIcelanderIndian (Asian)IndonesianInupiatIranianIraqiIrishIroquoisIsraeliItalianJamaicanJapaneseJordanianKenyanKiowaKoreanLaotianLatvianLebaneseLiberianLithuanianLumbeeLuxembourgerMacedonianMalaysianMalteseMarshalleseMenomineeMexicanMexican American IndianMongolianMoroccanNative HawaiianNavajoNepaleseNew ZealanderNicaraguanNigerianNorthern EuropeanNorwegianOkinawanOsageOttawaPaiutePakistaniPalestinianPanamanianParaguayanPennsylvania GermanPeruvianPimaPolishPortuguesePotawatomiPuebloPuerto RicanPuget Sound SalishRomanianRussianSalvadoranSamoanScandinavianScotch-IrishScottishSeminoleSenegaleseSerbianShoshoneSierra LeoneanSiouxSlavicSlovakSloveneSomaliSouth AfricanSouth AmericanSouth American IndianSoviet UnionSpaniardSpanishSpanish AmericanSpanish American IndianSri LankanSubsaharan AfricanSudaneseSwedishSwissSyrianTaiwaneseThaiTlingit-HaidaTohono O'OdhamTonganTrinidadian and TobagonianTsimshianTurkishU.S. Virgin IslanderUgandanUkrainianUruguayanUteVenezuelanVietnameseWelshWest IndianYakamaYaquiYugoslavianYumanYup'ikZimbabwean
Immigration
NonimmigrantsImmigrantsAfghanistanAfricaAlbaniaArgentinaArmeniaAsiaAustraliaAustriaBahamasBangladeshBarbadosBelarusBelgiumBelizeBoliviaBosnia and HerzegovinaBrazilBulgariaBurma/MyanmarCabo VerdeCambodiaCameroonCanadaCaribbeanCentral AmericaChileChinaColombiaCongoCosta RicaCroatiaCubaCzechoslovakiaDenmarkDominicaDominican RepublicEastern AfricaEastern AsiaEastern EuropeEcuadorEgyptEl SalvadorEnglandEritreaEthiopiaEuropeFijiFranceGermanyGhanaGreeceGrenadaGuatemalaGuyanaHaitiHondurasHong KongHungaryIndiaIndonesiaIranIraqIrelandIsraelItalyJamaicaJapanJordanKazakhstanKenyaKoreaKuwaitLaosLatin AmericaLatviaLebanonLiberiaLithuaniaMalaysiaMexicoMicronesiaMiddle AfricaMoldovaMoroccoNepalNetherlandsNicaraguaNigeriaNorth AmericaNorth MacedoniaNorthern AfricaNorthern EuropeNorwayOceaniaPakistanPanamaPeruPhilippinesPolandPortugalRomaniaRussiaSaudi ArabiaScotlandSenegalSerbiaSierra LeoneSingaporeSomaliaSouth AfricaSouth AmericaSouth Central AsiaSouth Eastern AsiaSouthern EuropeSpainSri LankaSt. Vincent and the GrenadinesSudanSwedenSwitzerlandSyriaTaiwanThailandTrinidad and TobagoTurkeyUgandaUkraineUruguayUzbekistanVenezuelaVietnamWest IndiesWestern AfricaWestern AsiaWestern EuropeYemenZaireZimbabweAzores
Doctorate Degree
Income
Poverty
Unemployment
Labor Participation
Family Structure
Vehicle Availability
Education Level
Disability

Doctorate Degree Comparison

Chinese

Sierra Leoneans

Fair
Excellent
1.8%
DOCTORATE DEGREE
25.1/ 100
METRIC RATING
197th/ 347
METRIC RANK
2.0%
DOCTORATE DEGREE
85.1/ 100
METRIC RATING
143rd/ 347
METRIC RANK

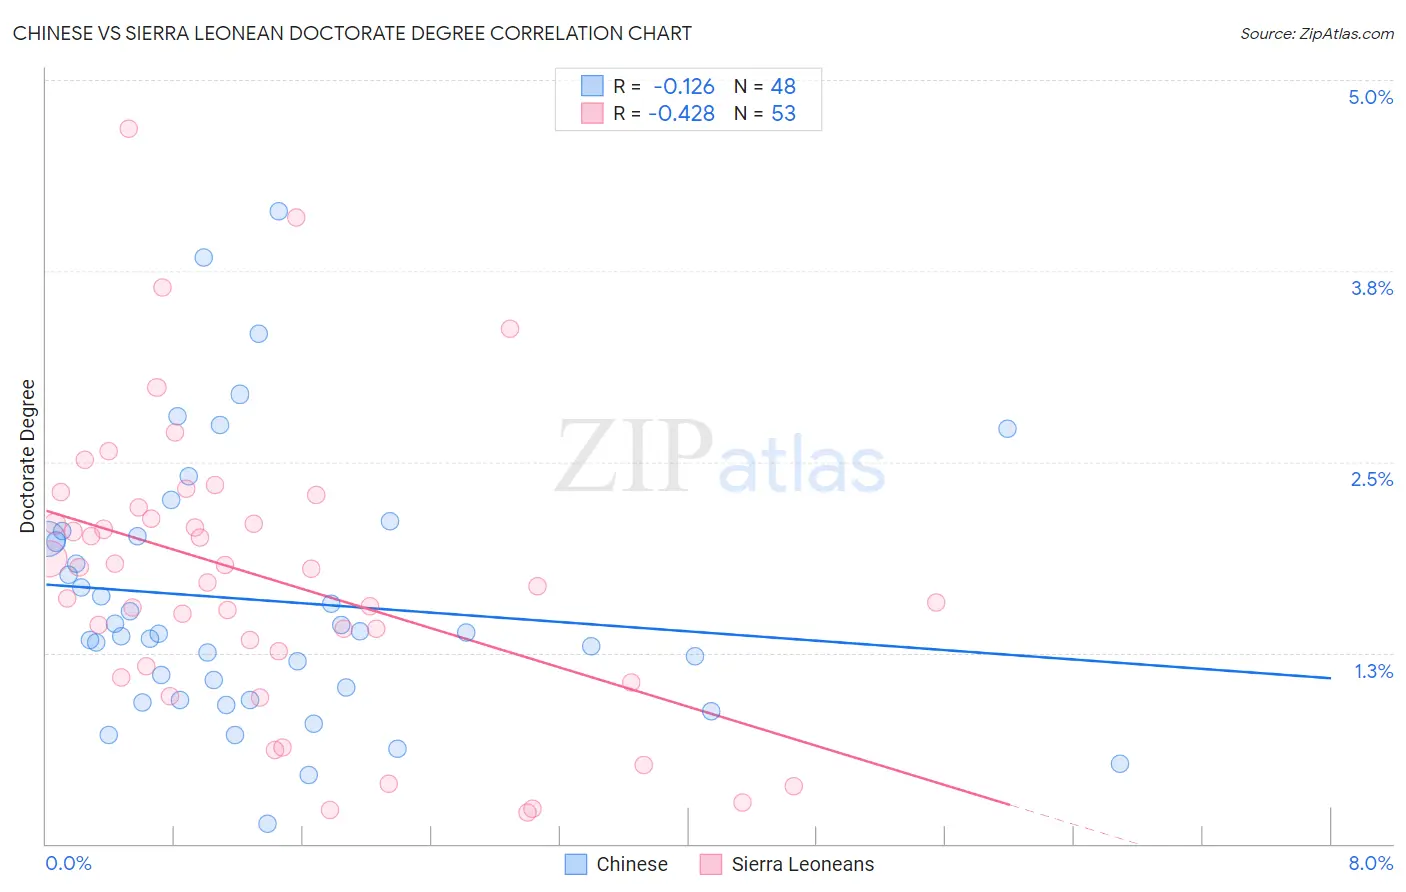
Chinese vs Sierra Leonean Doctorate Degree Correlation Chart

The statistical analysis conducted on geographies consisting of 64,665,002 people shows a poor negative correlation between the proportion of Chinese and percentage of population with at least doctorate degree education in the United States with a correlation coefficient (R) of -0.126 and weighted average of 1.8%. Similarly, the statistical analysis conducted on geographies consisting of 83,237,718 people shows a moderate negative correlation between the proportion of Sierra Leoneans and percentage of population with at least doctorate degree education in the United States with a correlation coefficient (R) of -0.428 and weighted average of 2.0%, a difference of 10.8%.
Chinese vs Sierra Leonean Doctorate Degree

Doctorate Degree Correlation Summary

MeasurementChineseSierra Leonean
Minimum0.13%0.21%
Maximum4.1%4.7%
Range4.0%4.5%
Mean1.6%1.7%
Median1.4%1.7%
Interquartile 25% (IQ1)0.98%1.1%
Interquartile 75% (IQ3)2.0%2.2%
Interquartile Range (IQR)1.0%1.0%
Standard Deviation (Sample)0.86%0.95%
Standard Deviation (Population)0.85%0.94%

Similar Demographics by Doctorate Degree

Demographics Similar to Chinese by Doctorate Degree

In terms of doctorate degree, the demographic groups most similar to Chinese are Subsaharan African (1.8%, a difference of 0.0%), Immigrants from Somalia (1.8%, a difference of 0.070%), Immigrants from Ghana (1.8%, a difference of 0.080%), Uruguayan (1.8%, a difference of 0.23%), and Immigrants from South America (1.8%, a difference of 0.37%).
DemographicsRating | RankDoctorate Degree
Immigrants | Costa Rica
30.2
/100
|
#190
Fair
1.8%
South Americans
29.5
/100
|
#191
Fair
1.8%
Dutch
27.4
/100
|
#192
Fair
1.8%
German Russians
27.1
/100
|
#193
Fair
1.8%
Uruguayans
26.2
/100
|
#194
Fair
1.8%
Immigrants | Somalia
25.4
/100
|
#195
Fair
1.8%
Sub-Saharan Africans
25.1
/100
|
#196
Fair
1.8%
Chinese
25.1
/100
|
#197
Fair
1.8%
Immigrants | Ghana
24.6
/100
|
#198
Fair
1.8%
Immigrants | South America
23.3
/100
|
#199
Fair
1.8%
Whites/Caucasians
22.8
/100
|
#200
Fair
1.8%
Immigrants | Nigeria
22.4
/100
|
#201
Fair
1.8%
Portuguese
21.4
/100
|
#202
Fair
1.8%
Immigrants | Vietnam
21.4
/100
|
#203
Fair
1.8%
Somalis
21.2
/100
|
#204
Fair
1.7%

Demographics Similar to Sierra Leoneans by Doctorate Degree

In terms of doctorate degree, the demographic groups most similar to Sierra Leoneans are Immigrants from Moldova (2.0%, a difference of 0.21%), Italian (2.0%, a difference of 0.25%), Kenyan (1.9%, a difference of 0.39%), Immigrants from Syria (1.9%, a difference of 0.41%), and Senegalese (2.0%, a difference of 0.46%).
DemographicsRating | RankDoctorate Degree
Swedes
88.3
/100
|
#136
Excellent
2.0%
South American Indians
88.3
/100
|
#137
Excellent
2.0%
Swiss
88.0
/100
|
#138
Excellent
2.0%
Afghans
87.2
/100
|
#139
Excellent
2.0%
Immigrants | Africa
87.0
/100
|
#140
Excellent
2.0%
Senegalese
86.7
/100
|
#141
Excellent
2.0%
Italians
86.0
/100
|
#142
Excellent
2.0%
Sierra Leoneans
85.1
/100
|
#143
Excellent
2.0%
Immigrants | Moldova
84.3
/100
|
#144
Excellent
2.0%
Kenyans
83.6
/100
|
#145
Excellent
1.9%
Immigrants | Syria
83.6
/100
|
#146
Excellent
1.9%
Immigrants | Senegal
82.5
/100
|
#147
Excellent
1.9%
Luxembourgers
81.1
/100
|
#148
Excellent
1.9%
Basques
76.9
/100
|
#149
Good
1.9%
English
75.9
/100
|
#150
Good
1.9%