Chickasaw vs Immigrants from South America High School Diploma

COMPARE

Chickasaw
Race
Ancestry
AfghanAfricanAlaska NativeAlaskan AthabascanAlbanianAleutAlsatianAmericanApacheArabArapahoArgentineanArmenianAssyrian/Chaldean/SyriacAustralianAustrianBahamianBangladeshiBarbadianBasqueBelgianBelizeanBermudanBhutaneseBlackfeetBolivianBrazilianBritishBritish West IndianBulgarianBurmeseCajunCambodianCanadianCape VerdeanCarpatho RusynCelticCentral AmericanCentral American IndianCherokeeCheyenneChickasawChileanChineseChippewaChoctawColombianColvilleComancheCosta RicanCreeCreekCroatianCrowCubanCypriotCzechCzechoslovakianDanishDelawareDominicanDutchDutch West IndianEastern EuropeanEcuadorianEgyptianEnglishEstonianEthiopianEuropeanFijianFilipinoFinnishFrenchFrench American IndianFrench CanadianGermanGerman RussianGhanaianGreekGuamanian/ChamorroGuatemalanGuyaneseHaitianHmongHonduranHopiHoumaHungarianIcelanderIndian (Asian)IndonesianInupiatIranianIraqiIrishIroquoisIsraeliItalianJamaicanJapaneseJordanianKenyanKiowaKoreanLaotianLatvianLebaneseLiberianLithuanianLumbeeLuxembourgerMacedonianMalaysianMalteseMarshalleseMenomineeMexicanMexican American IndianMongolianMoroccanNative HawaiianNavajoNepaleseNew ZealanderNicaraguanNigerianNorthern EuropeanNorwegianOkinawanOsageOttawaPaiutePakistaniPalestinianPanamanianParaguayanPennsylvania GermanPeruvianPimaPolishPortuguesePotawatomiPuebloPuerto RicanPuget Sound SalishRomanianRussianSalvadoranSamoanScandinavianScotch-IrishScottishSeminoleSenegaleseSerbianShoshoneSierra LeoneanSiouxSlavicSlovakSloveneSomaliSouth AfricanSouth AmericanSouth American IndianSoviet UnionSpaniardSpanishSpanish AmericanSpanish American IndianSri LankanSubsaharan AfricanSudaneseSwedishSwissSyrianTaiwaneseThaiTlingit-HaidaTohono O'OdhamTonganTrinidadian and TobagonianTsimshianTurkishU.S. Virgin IslanderUgandanUkrainianUruguayanUteVenezuelanVietnameseWelshWest IndianYakamaYaquiYugoslavianYumanYup'ikZimbabwean
Immigration
NonimmigrantsImmigrantsAfghanistanAfricaAlbaniaArgentinaArmeniaAsiaAustraliaAustriaBahamasBangladeshBarbadosBelarusBelgiumBelizeBoliviaBosnia and HerzegovinaBrazilBulgariaBurma/MyanmarCabo VerdeCambodiaCameroonCanadaCaribbeanCentral AmericaChileChinaColombiaCongoCosta RicaCroatiaCubaCzechoslovakiaDenmarkDominicaDominican RepublicEastern AfricaEastern AsiaEastern EuropeEcuadorEgyptEl SalvadorEnglandEritreaEthiopiaEuropeFijiFranceGermanyGhanaGreeceGrenadaGuatemalaGuyanaHaitiHondurasHong KongHungaryIndiaIndonesiaIranIraqIrelandIsraelItalyJamaicaJapanJordanKazakhstanKenyaKoreaKuwaitLaosLatin AmericaLatviaLebanonLiberiaLithuaniaMalaysiaMexicoMicronesiaMiddle AfricaMoldovaMoroccoNepalNetherlandsNicaraguaNigeriaNorth AmericaNorth MacedoniaNorthern AfricaNorthern EuropeNorwayOceaniaPakistanPanamaPeruPhilippinesPolandPortugalRomaniaRussiaSaudi ArabiaScotlandSenegalSerbiaSierra LeoneSingaporeSomaliaSouth AfricaSouth Central AsiaSouth Eastern AsiaSouthern EuropeSpainSri LankaSt. Vincent and the GrenadinesSudanSwedenSwitzerlandSyriaTaiwanThailandTrinidad and TobagoTurkeyUgandaUkraineUruguayUzbekistanVenezuelaVietnamWest IndiesWestern AfricaWestern AsiaWestern EuropeYemenZaireZimbabweAzores
Immigrants from South America
Race
Ancestry
AfghanAfricanAlaska NativeAlaskan AthabascanAlbanianAleutAlsatianAmericanApacheArabArapahoArgentineanArmenianAssyrian/Chaldean/SyriacAustralianAustrianBahamianBangladeshiBarbadianBasqueBelgianBelizeanBermudanBhutaneseBlackfeetBolivianBrazilianBritishBritish West IndianBulgarianBurmeseCajunCambodianCanadianCape VerdeanCarpatho RusynCelticCentral AmericanCentral American IndianCherokeeCheyenneChileanChineseChippewaChoctawColombianColvilleComancheCosta RicanCreeCreekCroatianCrowCubanCypriotCzechCzechoslovakianDanishDelawareDominicanDutchDutch West IndianEastern EuropeanEcuadorianEgyptianEnglishEstonianEthiopianEuropeanFijianFilipinoFinnishFrenchFrench American IndianFrench CanadianGermanGerman RussianGhanaianGreekGuamanian/ChamorroGuatemalanGuyaneseHaitianHmongHonduranHopiHoumaHungarianIcelanderIndian (Asian)IndonesianInupiatIranianIraqiIrishIroquoisIsraeliItalianJamaicanJapaneseJordanianKenyanKiowaKoreanLaotianLatvianLebaneseLiberianLithuanianLumbeeLuxembourgerMacedonianMalaysianMalteseMarshalleseMenomineeMexicanMexican American IndianMongolianMoroccanNative HawaiianNavajoNepaleseNew ZealanderNicaraguanNigerianNorthern EuropeanNorwegianOkinawanOsageOttawaPaiutePakistaniPalestinianPanamanianParaguayanPennsylvania GermanPeruvianPimaPolishPortuguesePotawatomiPuebloPuerto RicanPuget Sound SalishRomanianRussianSalvadoranSamoanScandinavianScotch-IrishScottishSeminoleSenegaleseSerbianShoshoneSierra LeoneanSiouxSlavicSlovakSloveneSomaliSouth AfricanSouth AmericanSouth American IndianSoviet UnionSpaniardSpanishSpanish AmericanSpanish American IndianSri LankanSubsaharan AfricanSudaneseSwedishSwissSyrianTaiwaneseThaiTlingit-HaidaTohono O'OdhamTonganTrinidadian and TobagonianTsimshianTurkishU.S. Virgin IslanderUgandanUkrainianUruguayanUteVenezuelanVietnameseWelshWest IndianYakamaYaquiYugoslavianYumanYup'ikZimbabwean
Immigration
NonimmigrantsImmigrantsAfghanistanAfricaAlbaniaArgentinaArmeniaAsiaAustraliaAustriaBahamasBangladeshBarbadosBelarusBelgiumBelizeBoliviaBosnia and HerzegovinaBrazilBulgariaBurma/MyanmarCabo VerdeCambodiaCameroonCanadaCaribbeanCentral AmericaChileChinaColombiaCongoCosta RicaCroatiaCubaCzechoslovakiaDenmarkDominicaDominican RepublicEastern AfricaEastern AsiaEastern EuropeEcuadorEgyptEl SalvadorEnglandEritreaEthiopiaEuropeFijiFranceGermanyGhanaGreeceGrenadaGuatemalaGuyanaHaitiHondurasHong KongHungaryIndiaIndonesiaIranIraqIrelandIsraelItalyJamaicaJapanJordanKazakhstanKenyaKoreaKuwaitLaosLatin AmericaLatviaLebanonLiberiaLithuaniaMalaysiaMexicoMicronesiaMiddle AfricaMoldovaMoroccoNepalNetherlandsNicaraguaNigeriaNorth AmericaNorth MacedoniaNorthern AfricaNorthern EuropeNorwayOceaniaPakistanPanamaPeruPhilippinesPolandPortugalRomaniaRussiaSaudi ArabiaScotlandSenegalSerbiaSierra LeoneSingaporeSomaliaSouth AfricaSouth AmericaSouth Central AsiaSouth Eastern AsiaSouthern EuropeSpainSri LankaSt. Vincent and the GrenadinesSudanSwedenSwitzerlandSyriaTaiwanThailandTrinidad and TobagoTurkeyUgandaUkraineUruguayUzbekistanVenezuelaVietnamWest IndiesWestern AfricaWestern AsiaWestern EuropeYemenZaireZimbabweAzores
High School Diploma
Income
Poverty
Unemployment
Labor Participation
Family Structure
Vehicle Availability
Education Level
Disability

High School Diploma Comparison

Chickasaw

Immigrants from South America

Poor
Tragic
88.4%
HIGH SCHOOL DIPLOMA
10.7/ 100
METRIC RATING
216th/ 347
METRIC RANK
87.6%
HIGH SCHOOL DIPLOMA
1.2/ 100
METRIC RATING
252nd/ 347
METRIC RANK

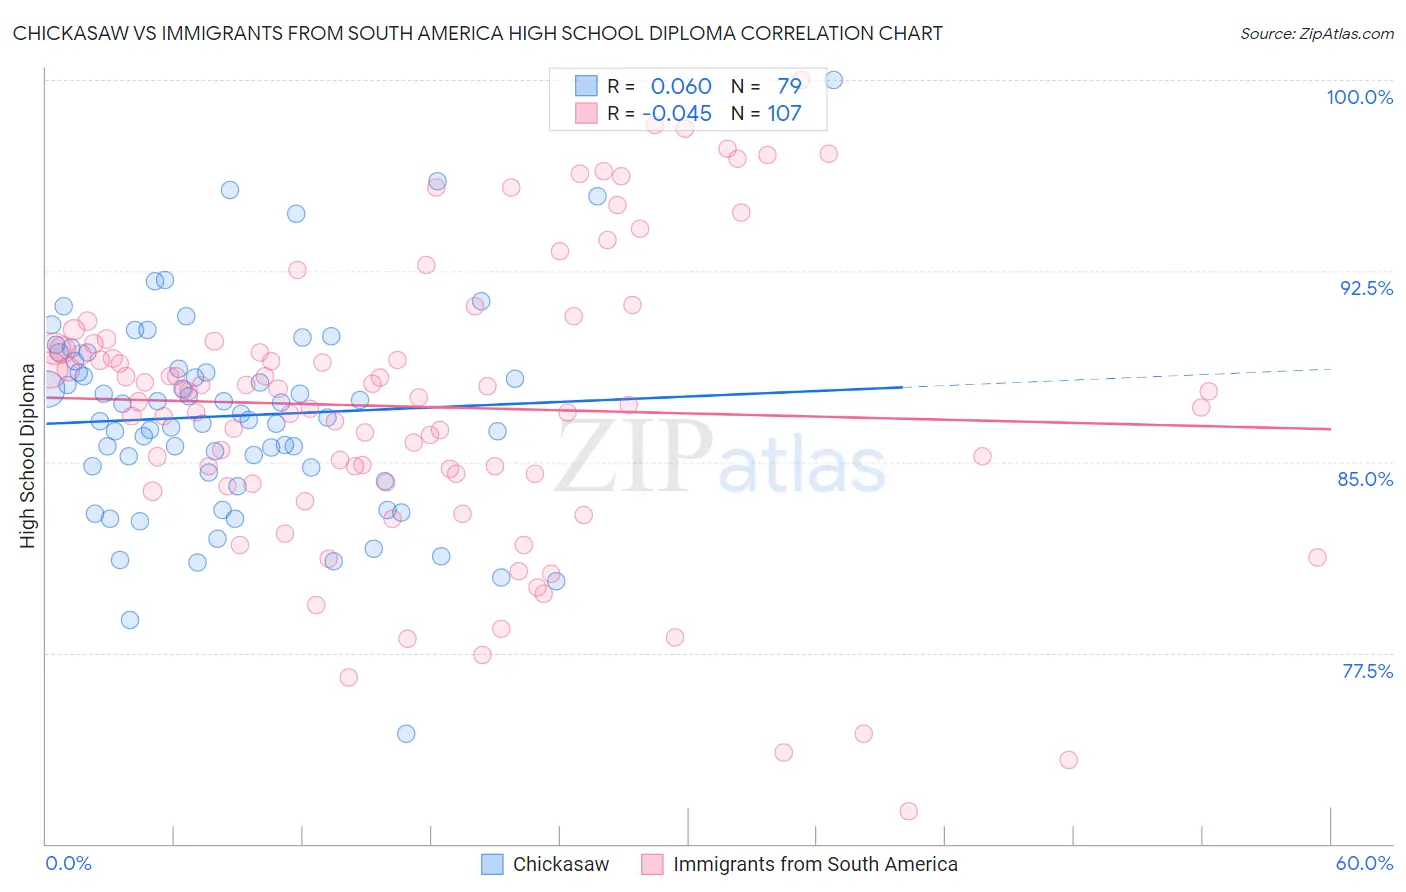
Chickasaw vs Immigrants from South America High School Diploma Correlation Chart

The statistical analysis conducted on geographies consisting of 147,726,791 people shows a slight positive correlation between the proportion of Chickasaw and percentage of population with at least high school diploma education in the United States with a correlation coefficient (R) of 0.060 and weighted average of 88.4%. Similarly, the statistical analysis conducted on geographies consisting of 486,312,594 people shows no correlation between the proportion of Immigrants from South America and percentage of population with at least high school diploma education in the United States with a correlation coefficient (R) of -0.045 and weighted average of 87.6%, a difference of 0.89%.
Chickasaw vs Immigrants from South America High School Diploma

High School Diploma Correlation Summary

MeasurementChickasawImmigrants from South America
Minimum74.3%71.3%
Maximum100.0%100.0%
Range25.7%28.7%
Mean86.8%87.2%
Median86.7%87.5%
Interquartile 25% (IQ1)84.6%84.2%
Interquartile 75% (IQ3)89.0%89.7%
Interquartile Range (IQR)4.4%5.5%
Standard Deviation (Sample)4.1%5.7%
Standard Deviation (Population)4.1%5.7%

Similar Demographics by High School Diploma

Demographics Similar to Chickasaw by High School Diploma

In terms of high school diploma, the demographic groups most similar to Chickasaw are Immigrants from Cameroon (88.4%, a difference of 0.010%), Crow (88.4%, a difference of 0.010%), Immigrants from Africa (88.4%, a difference of 0.010%), Immigrants from Somalia (88.4%, a difference of 0.020%), and Immigrants from Bolivia (88.4%, a difference of 0.020%).
DemographicsRating | RankHigh School Diploma
Cherokee
14.3
/100
|
#209
Poor
88.5%
Samoans
14.0
/100
|
#210
Poor
88.5%
Inupiat
13.1
/100
|
#211
Poor
88.5%
South American Indians
12.2
/100
|
#212
Poor
88.5%
Immigrants | Somalia
11.3
/100
|
#213
Poor
88.4%
Immigrants | Cameroon
10.9
/100
|
#214
Poor
88.4%
Crow
10.9
/100
|
#215
Poor
88.4%
Chickasaw
10.7
/100
|
#216
Poor
88.4%
Immigrants | Africa
10.6
/100
|
#217
Poor
88.4%
Immigrants | Bolivia
10.3
/100
|
#218
Poor
88.4%
Costa Ricans
9.6
/100
|
#219
Tragic
88.4%
Tongans
9.5
/100
|
#220
Tragic
88.4%
Immigrants | Afghanistan
8.6
/100
|
#221
Tragic
88.3%
Colville
7.8
/100
|
#222
Tragic
88.3%
Immigrants | Zaire
7.6
/100
|
#223
Tragic
88.3%

Demographics Similar to Immigrants from South America by High School Diploma

In terms of high school diploma, the demographic groups most similar to Immigrants from South America are Immigrants from Uruguay (87.6%, a difference of 0.050%), Immigrants from Colombia (87.6%, a difference of 0.050%), Ghanaian (87.7%, a difference of 0.060%), Senegalese (87.7%, a difference of 0.10%), and Immigrants from Nigeria (87.7%, a difference of 0.10%).
DemographicsRating | RankHigh School Diploma
Peruvians
1.9
/100
|
#245
Tragic
87.8%
Immigrants | Eritrea
1.7
/100
|
#246
Tragic
87.8%
Immigrants | Costa Rica
1.7
/100
|
#247
Tragic
87.8%
Spanish Americans
1.5
/100
|
#248
Tragic
87.7%
Senegalese
1.5
/100
|
#249
Tragic
87.7%
Immigrants | Nigeria
1.5
/100
|
#250
Tragic
87.7%
Ghanaians
1.4
/100
|
#251
Tragic
87.7%
Immigrants | South America
1.2
/100
|
#252
Tragic
87.6%
Immigrants | Uruguay
1.0
/100
|
#253
Tragic
87.6%
Immigrants | Colombia
1.0
/100
|
#254
Tragic
87.6%
Immigrants | Senegal
0.9
/100
|
#255
Tragic
87.6%
Africans
0.7
/100
|
#256
Tragic
87.5%
Bahamians
0.7
/100
|
#257
Tragic
87.5%
Immigrants | Ghana
0.5
/100
|
#258
Tragic
87.4%
Immigrants | Western Africa
0.5
/100
|
#259
Tragic
87.4%