Australian vs Native/Alaskan High School Diploma

COMPARE

Australian
Race
Ancestry
AfghanAfricanAlaska NativeAlaskan AthabascanAlbanianAleutAlsatianAmericanApacheArabArapahoArgentineanArmenianAssyrian/Chaldean/SyriacAustralianAustrianBahamianBangladeshiBarbadianBasqueBelgianBelizeanBermudanBhutaneseBlackfeetBolivianBrazilianBritishBritish West IndianBulgarianBurmeseCajunCambodianCanadianCape VerdeanCarpatho RusynCelticCentral AmericanCentral American IndianCherokeeCheyenneChickasawChileanChineseChippewaChoctawColombianColvilleComancheCosta RicanCreeCreekCroatianCrowCubanCypriotCzechCzechoslovakianDanishDelawareDominicanDutchDutch West IndianEastern EuropeanEcuadorianEgyptianEnglishEstonianEthiopianEuropeanFijianFilipinoFinnishFrenchFrench American IndianFrench CanadianGermanGerman RussianGhanaianGreekGuamanian/ChamorroGuatemalanGuyaneseHaitianHmongHonduranHopiHoumaHungarianIcelanderIndian (Asian)IndonesianInupiatIranianIraqiIrishIroquoisIsraeliItalianJamaicanJapaneseJordanianKenyanKiowaKoreanLaotianLatvianLebaneseLiberianLithuanianLumbeeLuxembourgerMacedonianMalaysianMalteseMarshalleseMenomineeMexicanMexican American IndianMongolianMoroccanNative HawaiianNavajoNepaleseNew ZealanderNicaraguanNigerianNorthern EuropeanNorwegianOkinawanOsageOttawaPaiutePakistaniPalestinianPanamanianParaguayanPennsylvania GermanPeruvianPimaPolishPortuguesePotawatomiPuebloPuerto RicanPuget Sound SalishRomanianRussianSalvadoranSamoanScandinavianScotch-IrishScottishSeminoleSenegaleseSerbianShoshoneSierra LeoneanSiouxSlavicSlovakSloveneSomaliSouth AfricanSouth AmericanSouth American IndianSoviet UnionSpaniardSpanishSpanish AmericanSpanish American IndianSri LankanSubsaharan AfricanSudaneseSwedishSwissSyrianTaiwaneseThaiTlingit-HaidaTohono O'OdhamTonganTrinidadian and TobagonianTsimshianTurkishU.S. Virgin IslanderUgandanUkrainianUruguayanUteVenezuelanVietnameseWelshWest IndianYakamaYaquiYugoslavianYumanYup'ikZimbabwean
Immigration
NonimmigrantsImmigrantsAfghanistanAfricaAlbaniaArgentinaArmeniaAsiaAustraliaAustriaBahamasBangladeshBarbadosBelarusBelgiumBelizeBoliviaBosnia and HerzegovinaBrazilBulgariaBurma/MyanmarCabo VerdeCambodiaCameroonCanadaCaribbeanCentral AmericaChileChinaColombiaCongoCosta RicaCroatiaCubaCzechoslovakiaDenmarkDominicaDominican RepublicEastern AfricaEastern AsiaEastern EuropeEcuadorEgyptEl SalvadorEnglandEritreaEthiopiaEuropeFijiFranceGermanyGhanaGreeceGrenadaGuatemalaGuyanaHaitiHondurasHong KongHungaryIndiaIndonesiaIranIraqIrelandIsraelItalyJamaicaJapanJordanKazakhstanKenyaKoreaKuwaitLaosLatin AmericaLatviaLebanonLiberiaLithuaniaMalaysiaMexicoMicronesiaMiddle AfricaMoldovaMoroccoNepalNetherlandsNicaraguaNigeriaNorth AmericaNorth MacedoniaNorthern AfricaNorthern EuropeNorwayOceaniaPakistanPanamaPeruPhilippinesPolandPortugalRomaniaRussiaSaudi ArabiaScotlandSenegalSerbiaSierra LeoneSingaporeSomaliaSouth AfricaSouth AmericaSouth Central AsiaSouth Eastern AsiaSouthern EuropeSpainSri LankaSt. Vincent and the GrenadinesSudanSwedenSwitzerlandSyriaTaiwanThailandTrinidad and TobagoTurkeyUgandaUkraineUruguayUzbekistanVenezuelaVietnamWest IndiesWestern AfricaWestern AsiaWestern EuropeYemenZaireZimbabweAzores
Native/Alaskan
Race
Ancestry
AfghanAfricanAlaska NativeAlaskan AthabascanAlbanianAleutAlsatianAmericanApacheArabArapahoArgentineanArmenianAssyrian/Chaldean/SyriacAustrianBahamianBangladeshiBarbadianBasqueBelgianBelizeanBermudanBhutaneseBlackfeetBolivianBrazilianBritishBritish West IndianBulgarianBurmeseCajunCambodianCanadianCape VerdeanCarpatho RusynCelticCentral AmericanCentral American IndianCherokeeCheyenneChickasawChileanChineseChippewaChoctawColombianColvilleComancheCosta RicanCreeCreekCroatianCrowCubanCypriotCzechCzechoslovakianDanishDelawareDominicanDutchDutch West IndianEastern EuropeanEcuadorianEgyptianEnglishEstonianEthiopianEuropeanFijianFilipinoFinnishFrenchFrench American IndianFrench CanadianGermanGerman RussianGhanaianGreekGuamanian/ChamorroGuatemalanGuyaneseHaitianHmongHonduranHopiHoumaHungarianIcelanderIndian (Asian)IndonesianInupiatIranianIraqiIrishIroquoisIsraeliItalianJamaicanJapaneseJordanianKenyanKiowaKoreanLaotianLatvianLebaneseLiberianLithuanianLumbeeLuxembourgerMacedonianMalaysianMalteseMarshalleseMenomineeMexicanMexican American IndianMongolianMoroccanNative HawaiianNavajoNepaleseNew ZealanderNicaraguanNigerianNorthern EuropeanNorwegianOkinawanOsageOttawaPaiutePakistaniPalestinianPanamanianParaguayanPennsylvania GermanPeruvianPimaPolishPortuguesePotawatomiPuebloPuerto RicanPuget Sound SalishRomanianRussianSalvadoranSamoanScandinavianScotch-IrishScottishSeminoleSenegaleseSerbianShoshoneSierra LeoneanSiouxSlavicSlovakSloveneSomaliSouth AfricanSouth AmericanSouth American IndianSoviet UnionSpaniardSpanishSpanish AmericanSpanish American IndianSri LankanSubsaharan AfricanSudaneseSwedishSwissSyrianTaiwaneseThaiTlingit-HaidaTohono O'OdhamTonganTrinidadian and TobagonianTsimshianTurkishU.S. Virgin IslanderUgandanUkrainianUruguayanUteVenezuelanVietnameseWelshWest IndianYakamaYaquiYugoslavianYumanYup'ikZimbabwean
Immigration
NonimmigrantsImmigrantsAfghanistanAfricaAlbaniaArgentinaArmeniaAsiaAustraliaAustriaBahamasBangladeshBarbadosBelarusBelgiumBelizeBoliviaBosnia and HerzegovinaBrazilBulgariaBurma/MyanmarCabo VerdeCambodiaCameroonCanadaCaribbeanCentral AmericaChileChinaColombiaCongoCosta RicaCroatiaCubaCzechoslovakiaDenmarkDominicaDominican RepublicEastern AfricaEastern AsiaEastern EuropeEcuadorEgyptEl SalvadorEnglandEritreaEthiopiaEuropeFijiFranceGermanyGhanaGreeceGrenadaGuatemalaGuyanaHaitiHondurasHong KongHungaryIndiaIndonesiaIranIraqIrelandIsraelItalyJamaicaJapanJordanKazakhstanKenyaKoreaKuwaitLaosLatin AmericaLatviaLebanonLiberiaLithuaniaMalaysiaMexicoMicronesiaMiddle AfricaMoldovaMoroccoNepalNetherlandsNicaraguaNigeriaNorth AmericaNorth MacedoniaNorthern AfricaNorthern EuropeNorwayOceaniaPakistanPanamaPeruPhilippinesPolandPortugalRomaniaRussiaSaudi ArabiaScotlandSenegalSerbiaSierra LeoneSingaporeSomaliaSouth AfricaSouth AmericaSouth Central AsiaSouth Eastern AsiaSouthern EuropeSpainSri LankaSt. Vincent and the GrenadinesSudanSwedenSwitzerlandSyriaTaiwanThailandTrinidad and TobagoTurkeyUgandaUkraineUruguayUzbekistanVenezuelaVietnamWest IndiesWestern AfricaWestern AsiaWestern EuropeYemenZaireZimbabweAzores
High School Diploma
Income
Poverty
Unemployment
Labor Participation
Family Structure
Vehicle Availability
Education Level
Disability

High School Diploma Comparison

Australians

Natives/Alaskans

Exceptional
Tragic
91.2%
HIGH SCHOOL DIPLOMA
99.8/ 100
METRIC RATING
47th/ 347
METRIC RANK
85.6%
HIGH SCHOOL DIPLOMA
0.0/ 100
METRIC RATING
298th/ 347
METRIC RANK

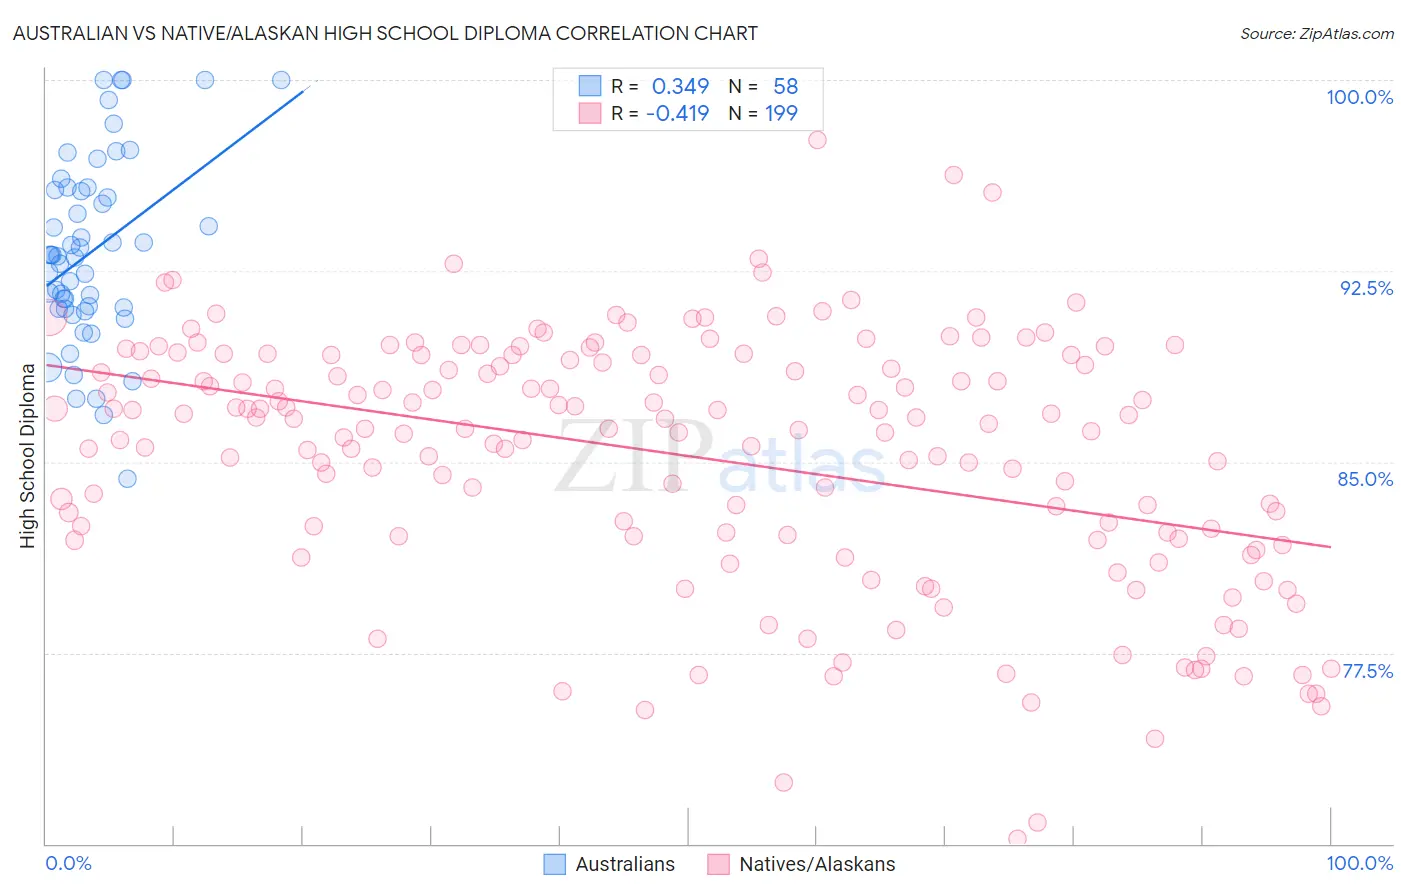
Australian vs Native/Alaskan High School Diploma Correlation Chart

The statistical analysis conducted on geographies consisting of 224,152,919 people shows a mild positive correlation between the proportion of Australians and percentage of population with at least high school diploma education in the United States with a correlation coefficient (R) of 0.349 and weighted average of 91.2%. Similarly, the statistical analysis conducted on geographies consisting of 513,075,731 people shows a moderate negative correlation between the proportion of Natives/Alaskans and percentage of population with at least high school diploma education in the United States with a correlation coefficient (R) of -0.419 and weighted average of 85.6%, a difference of 6.6%.
Australian vs Native/Alaskan High School Diploma

High School Diploma Correlation Summary

MeasurementAustralianNative/Alaskan
Minimum84.3%70.2%
Maximum100.0%97.6%
Range15.7%27.5%
Mean93.3%85.2%
Median93.1%86.3%
Interquartile 25% (IQ1)91.0%82.1%
Interquartile 75% (IQ3)95.7%89.2%
Interquartile Range (IQR)4.7%7.1%
Standard Deviation (Sample)3.6%5.0%
Standard Deviation (Population)3.6%4.9%

Similar Demographics by High School Diploma

Demographics Similar to Australians by High School Diploma

In terms of high school diploma, the demographic groups most similar to Australians are Belgian (91.2%, a difference of 0.0%), Greek (91.2%, a difference of 0.010%), Bhutanese (91.2%, a difference of 0.010%), Welsh (91.2%, a difference of 0.030%), and Immigrants from Austria (91.3%, a difference of 0.050%).
DemographicsRating | RankHigh School Diploma
Immigrants | Lithuania
99.8
/100
|
#40
Exceptional
91.3%
Immigrants | Australia
99.8
/100
|
#41
Exceptional
91.3%
Northern Europeans
99.8
/100
|
#42
Exceptional
91.3%
British
99.8
/100
|
#43
Exceptional
91.3%
Immigrants | Austria
99.8
/100
|
#44
Exceptional
91.3%
Turks
99.8
/100
|
#45
Exceptional
91.2%
Greeks
99.8
/100
|
#46
Exceptional
91.2%
Australians
99.8
/100
|
#47
Exceptional
91.2%
Belgians
99.8
/100
|
#48
Exceptional
91.2%
Bhutanese
99.8
/100
|
#49
Exceptional
91.2%
Welsh
99.8
/100
|
#50
Exceptional
91.2%
New Zealanders
99.7
/100
|
#51
Exceptional
91.1%
Immigrants | Sweden
99.7
/100
|
#52
Exceptional
91.1%
Immigrants | Belgium
99.7
/100
|
#53
Exceptional
91.1%
Macedonians
99.7
/100
|
#54
Exceptional
91.1%

Demographics Similar to Natives/Alaskans by High School Diploma

In terms of high school diploma, the demographic groups most similar to Natives/Alaskans are Immigrants from Grenada (85.6%, a difference of 0.020%), Immigrants from Cambodia (85.6%, a difference of 0.090%), Guyanese (85.5%, a difference of 0.10%), Immigrants from Bangladesh (85.5%, a difference of 0.12%), and Vietnamese (85.4%, a difference of 0.14%).
DemographicsRating | RankHigh School Diploma
Haitians
0.0
/100
|
#291
Tragic
85.9%
Japanese
0.0
/100
|
#292
Tragic
85.9%
British West Indians
0.0
/100
|
#293
Tragic
85.9%
Immigrants | Fiji
0.0
/100
|
#294
Tragic
85.8%
Immigrants | Immigrants
0.0
/100
|
#295
Tragic
85.8%
Immigrants | Cambodia
0.0
/100
|
#296
Tragic
85.6%
Immigrants | Grenada
0.0
/100
|
#297
Tragic
85.6%
Natives/Alaskans
0.0
/100
|
#298
Tragic
85.6%
Guyanese
0.0
/100
|
#299
Tragic
85.5%
Immigrants | Bangladesh
0.0
/100
|
#300
Tragic
85.5%
Vietnamese
0.0
/100
|
#301
Tragic
85.4%
Immigrants | Haiti
0.0
/100
|
#302
Tragic
85.4%
Cubans
0.0
/100
|
#303
Tragic
85.4%
Nepalese
0.0
/100
|
#304
Tragic
85.3%
Immigrants | Portugal
0.0
/100
|
#305
Tragic
85.3%