Australian vs Immigrants from China Professional Degree

COMPARE

Australian
Race
Ancestry
AfghanAfricanAlaska NativeAlaskan AthabascanAlbanianAleutAlsatianAmericanApacheArabArapahoArgentineanArmenianAssyrian/Chaldean/SyriacAustralianAustrianBahamianBangladeshiBarbadianBasqueBelgianBelizeanBermudanBhutaneseBlackfeetBolivianBrazilianBritishBritish West IndianBulgarianBurmeseCajunCambodianCanadianCape VerdeanCarpatho RusynCelticCentral AmericanCentral American IndianCherokeeCheyenneChickasawChileanChineseChippewaChoctawColombianColvilleComancheCosta RicanCreeCreekCroatianCrowCubanCypriotCzechCzechoslovakianDanishDelawareDominicanDutchDutch West IndianEastern EuropeanEcuadorianEgyptianEnglishEstonianEthiopianEuropeanFijianFilipinoFinnishFrenchFrench American IndianFrench CanadianGermanGerman RussianGhanaianGreekGuamanian/ChamorroGuatemalanGuyaneseHaitianHmongHonduranHopiHoumaHungarianIcelanderIndian (Asian)IndonesianInupiatIranianIraqiIrishIroquoisIsraeliItalianJamaicanJapaneseJordanianKenyanKiowaKoreanLaotianLatvianLebaneseLiberianLithuanianLumbeeLuxembourgerMacedonianMalaysianMalteseMarshalleseMenomineeMexicanMexican American IndianMongolianMoroccanNative HawaiianNavajoNepaleseNew ZealanderNicaraguanNigerianNorthern EuropeanNorwegianOkinawanOsageOttawaPaiutePakistaniPalestinianPanamanianParaguayanPennsylvania GermanPeruvianPimaPolishPortuguesePotawatomiPuebloPuerto RicanPuget Sound SalishRomanianRussianSalvadoranSamoanScandinavianScotch-IrishScottishSeminoleSenegaleseSerbianShoshoneSierra LeoneanSiouxSlavicSlovakSloveneSomaliSouth AfricanSouth AmericanSouth American IndianSoviet UnionSpaniardSpanishSpanish AmericanSpanish American IndianSri LankanSubsaharan AfricanSudaneseSwedishSwissSyrianTaiwaneseThaiTlingit-HaidaTohono O'OdhamTonganTrinidadian and TobagonianTsimshianTurkishU.S. Virgin IslanderUgandanUkrainianUruguayanUteVenezuelanVietnameseWelshWest IndianYakamaYaquiYugoslavianYumanYup'ikZimbabwean
Immigration
NonimmigrantsImmigrantsAfghanistanAfricaAlbaniaArgentinaArmeniaAsiaAustraliaAustriaBahamasBangladeshBarbadosBelarusBelgiumBelizeBoliviaBosnia and HerzegovinaBrazilBulgariaBurma/MyanmarCabo VerdeCambodiaCameroonCanadaCaribbeanCentral AmericaChileColombiaCongoCosta RicaCroatiaCubaCzechoslovakiaDenmarkDominicaDominican RepublicEastern AfricaEastern AsiaEastern EuropeEcuadorEgyptEl SalvadorEnglandEritreaEthiopiaEuropeFijiFranceGermanyGhanaGreeceGrenadaGuatemalaGuyanaHaitiHondurasHong KongHungaryIndiaIndonesiaIranIraqIrelandIsraelItalyJamaicaJapanJordanKazakhstanKenyaKoreaKuwaitLaosLatin AmericaLatviaLebanonLiberiaLithuaniaMalaysiaMexicoMicronesiaMiddle AfricaMoldovaMoroccoNepalNetherlandsNicaraguaNigeriaNorth AmericaNorth MacedoniaNorthern AfricaNorthern EuropeNorwayOceaniaPakistanPanamaPeruPhilippinesPolandPortugalRomaniaRussiaSaudi ArabiaScotlandSenegalSerbiaSierra LeoneSingaporeSomaliaSouth AfricaSouth AmericaSouth Central AsiaSouth Eastern AsiaSouthern EuropeSpainSri LankaSt. Vincent and the GrenadinesSudanSwedenSwitzerlandSyriaTaiwanThailandTrinidad and TobagoTurkeyUgandaUkraineUruguayUzbekistanVenezuelaVietnamWest IndiesWestern AfricaWestern AsiaWestern EuropeYemenZaireZimbabweAzores
Immigrants from China
Race
Ancestry
AfghanAfricanAlaska NativeAlaskan AthabascanAlbanianAleutAlsatianAmericanApacheArabArapahoArgentineanArmenianAssyrian/Chaldean/SyriacAustrianBahamianBangladeshiBarbadianBasqueBelgianBelizeanBermudanBhutaneseBlackfeetBolivianBrazilianBritishBritish West IndianBulgarianBurmeseCajunCambodianCanadianCape VerdeanCarpatho RusynCelticCentral AmericanCentral American IndianCherokeeCheyenneChickasawChileanChineseChippewaChoctawColombianColvilleComancheCosta RicanCreeCreekCroatianCrowCubanCypriotCzechCzechoslovakianDanishDelawareDominicanDutchDutch West IndianEastern EuropeanEcuadorianEgyptianEnglishEstonianEthiopianEuropeanFijianFilipinoFinnishFrenchFrench American IndianFrench CanadianGermanGerman RussianGhanaianGreekGuamanian/ChamorroGuatemalanGuyaneseHaitianHmongHonduranHopiHoumaHungarianIcelanderIndian (Asian)IndonesianInupiatIranianIraqiIrishIroquoisIsraeliItalianJamaicanJapaneseJordanianKenyanKiowaKoreanLaotianLatvianLebaneseLiberianLithuanianLumbeeLuxembourgerMacedonianMalaysianMalteseMarshalleseMenomineeMexicanMexican American IndianMongolianMoroccanNative HawaiianNavajoNepaleseNew ZealanderNicaraguanNigerianNorthern EuropeanNorwegianOkinawanOsageOttawaPaiutePakistaniPalestinianPanamanianParaguayanPennsylvania GermanPeruvianPimaPolishPortuguesePotawatomiPuebloPuerto RicanPuget Sound SalishRomanianRussianSalvadoranSamoanScandinavianScotch-IrishScottishSeminoleSenegaleseSerbianShoshoneSierra LeoneanSiouxSlavicSlovakSloveneSomaliSouth AfricanSouth AmericanSouth American IndianSoviet UnionSpaniardSpanishSpanish AmericanSpanish American IndianSri LankanSubsaharan AfricanSudaneseSwedishSwissSyrianTaiwaneseThaiTlingit-HaidaTohono O'OdhamTonganTrinidadian and TobagonianTsimshianTurkishU.S. Virgin IslanderUgandanUkrainianUruguayanUteVenezuelanVietnameseWelshWest IndianYakamaYaquiYugoslavianYumanYup'ikZimbabwean
Immigration
NonimmigrantsImmigrantsAfghanistanAfricaAlbaniaArgentinaArmeniaAsiaAustraliaAustriaBahamasBangladeshBarbadosBelarusBelgiumBelizeBoliviaBosnia and HerzegovinaBrazilBulgariaBurma/MyanmarCabo VerdeCambodiaCameroonCanadaCaribbeanCentral AmericaChileChinaColombiaCongoCosta RicaCroatiaCubaCzechoslovakiaDenmarkDominicaDominican RepublicEastern AfricaEastern AsiaEastern EuropeEcuadorEgyptEl SalvadorEnglandEritreaEthiopiaEuropeFijiFranceGermanyGhanaGreeceGrenadaGuatemalaGuyanaHaitiHondurasHong KongHungaryIndiaIndonesiaIranIraqIrelandIsraelItalyJamaicaJapanJordanKazakhstanKenyaKoreaKuwaitLaosLatin AmericaLatviaLebanonLiberiaLithuaniaMalaysiaMexicoMicronesiaMiddle AfricaMoldovaMoroccoNepalNetherlandsNicaraguaNigeriaNorth AmericaNorth MacedoniaNorthern AfricaNorthern EuropeNorwayOceaniaPakistanPanamaPeruPhilippinesPolandPortugalRomaniaRussiaSaudi ArabiaScotlandSenegalSerbiaSierra LeoneSingaporeSomaliaSouth AfricaSouth AmericaSouth Central AsiaSouth Eastern AsiaSouthern EuropeSpainSri LankaSt. Vincent and the GrenadinesSudanSwedenSwitzerlandSyriaTaiwanThailandTrinidad and TobagoTurkeyUgandaUkraineUruguayUzbekistanVenezuelaVietnamWest IndiesWestern AfricaWestern AsiaWestern EuropeYemenZaireZimbabweAzores
Professional Degree
Income
Poverty
Unemployment
Labor Participation
Family Structure
Vehicle Availability
Education Level
Disability

Professional Degree Comparison

Australians

Immigrants from China

Exceptional
Exceptional
5.9%
PROFESSIONAL DEGREE
100.0/ 100
METRIC RATING
47th/ 347
METRIC RANK
6.7%
PROFESSIONAL DEGREE
100.0/ 100
METRIC RATING
15th/ 347
METRIC RANK

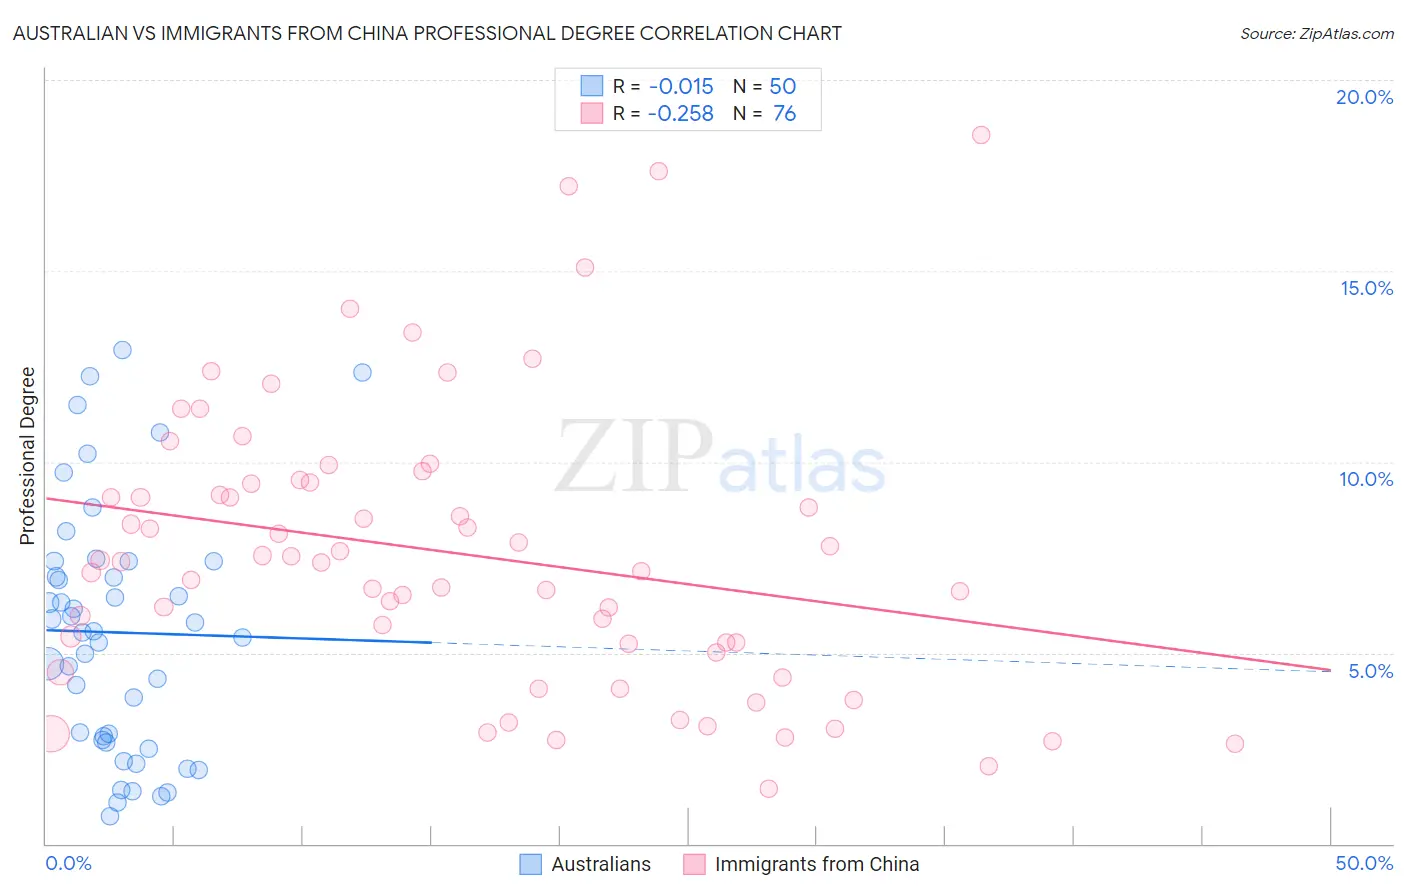
Australian vs Immigrants from China Professional Degree Correlation Chart

The statistical analysis conducted on geographies consisting of 223,901,125 people shows no correlation between the proportion of Australians and percentage of population with at least professional degree education in the United States with a correlation coefficient (R) of -0.015 and weighted average of 5.9%. Similarly, the statistical analysis conducted on geographies consisting of 455,966,204 people shows a weak negative correlation between the proportion of Immigrants from China and percentage of population with at least professional degree education in the United States with a correlation coefficient (R) of -0.258 and weighted average of 6.7%, a difference of 14.3%.
Australian vs Immigrants from China Professional Degree

Professional Degree Correlation Summary

MeasurementAustralianImmigrants from China
Minimum0.73%1.4%
Maximum12.9%18.6%
Range12.2%17.1%
Mean5.5%7.6%
Median5.5%7.4%
Interquartile 25% (IQ1)2.7%5.1%
Interquartile 75% (IQ3)7.4%9.5%
Interquartile Range (IQR)4.7%4.3%
Standard Deviation (Sample)3.2%3.7%
Standard Deviation (Population)3.2%3.7%

Similar Demographics by Professional Degree

Demographics Similar to Australians by Professional Degree

In terms of professional degree, the demographic groups most similar to Australians are Immigrants from Argentina (5.9%, a difference of 0.010%), Immigrants from South Central Asia (5.9%, a difference of 0.22%), Paraguayan (5.9%, a difference of 0.42%), Argentinean (5.9%, a difference of 0.66%), and Immigrants from Saudi Arabia (5.9%, a difference of 0.82%).
DemographicsRating | RankProfessional Degree
Cambodians
100.0
/100
|
#40
Exceptional
6.0%
New Zealanders
100.0
/100
|
#41
Exceptional
6.0%
Estonians
100.0
/100
|
#42
Exceptional
6.0%
Immigrants | Saudi Arabia
100.0
/100
|
#43
Exceptional
5.9%
Argentineans
100.0
/100
|
#44
Exceptional
5.9%
Immigrants | South Central Asia
100.0
/100
|
#45
Exceptional
5.9%
Immigrants | Argentina
100.0
/100
|
#46
Exceptional
5.9%
Australians
100.0
/100
|
#47
Exceptional
5.9%
Paraguayans
100.0
/100
|
#48
Exceptional
5.9%
Immigrants | Latvia
100.0
/100
|
#49
Exceptional
5.8%
Immigrants | Czechoslovakia
100.0
/100
|
#50
Exceptional
5.8%
Immigrants | Greece
100.0
/100
|
#51
Exceptional
5.8%
Immigrants | Serbia
100.0
/100
|
#52
Exceptional
5.8%
Immigrants | Netherlands
100.0
/100
|
#53
Exceptional
5.8%
Immigrants | Kuwait
100.0
/100
|
#54
Exceptional
5.7%

Demographics Similar to Immigrants from China by Professional Degree

In terms of professional degree, the demographic groups most similar to Immigrants from China are Immigrants from Sweden (6.7%, a difference of 0.45%), Immigrants from France (6.8%, a difference of 1.1%), Immigrants from Eastern Asia (6.6%, a difference of 2.5%), Soviet Union (6.6%, a difference of 2.5%), and Immigrants from Australia (6.9%, a difference of 2.6%).
DemographicsRating | RankProfessional Degree
Immigrants | Switzerland
100.0
/100
|
#8
Exceptional
7.1%
Immigrants | Taiwan
100.0
/100
|
#9
Exceptional
7.1%
Immigrants | Belgium
100.0
/100
|
#10
Exceptional
7.0%
Cypriots
100.0
/100
|
#11
Exceptional
6.9%
Israelis
100.0
/100
|
#12
Exceptional
6.9%
Immigrants | Australia
100.0
/100
|
#13
Exceptional
6.9%
Immigrants | France
100.0
/100
|
#14
Exceptional
6.8%
Immigrants | China
100.0
/100
|
#15
Exceptional
6.7%
Immigrants | Sweden
100.0
/100
|
#16
Exceptional
6.7%
Immigrants | Eastern Asia
100.0
/100
|
#17
Exceptional
6.6%
Soviet Union
100.0
/100
|
#18
Exceptional
6.6%
Indians (Asian)
100.0
/100
|
#19
Exceptional
6.5%
Immigrants | Denmark
100.0
/100
|
#20
Exceptional
6.4%
Immigrants | Hong Kong
100.0
/100
|
#21
Exceptional
6.4%
Immigrants | Japan
100.0
/100
|
#22
Exceptional
6.4%