Afghan vs Cree 11th Grade

COMPARE

Afghan
Race
Ancestry
AfghanAfricanAlaska NativeAlaskan AthabascanAlbanianAleutAlsatianAmericanApacheArabArapahoArgentineanArmenianAssyrian/Chaldean/SyriacAustralianAustrianBahamianBangladeshiBarbadianBasqueBelgianBelizeanBermudanBhutaneseBlackfeetBolivianBrazilianBritishBritish West IndianBulgarianBurmeseCajunCambodianCanadianCape VerdeanCarpatho RusynCelticCentral AmericanCentral American IndianCherokeeCheyenneChickasawChileanChineseChippewaChoctawColombianColvilleComancheCosta RicanCreekCroatianCrowCubanCypriotCzechCzechoslovakianDanishDelawareDominicanDutchDutch West IndianEastern EuropeanEcuadorianEgyptianEnglishEstonianEthiopianEuropeanFijianFilipinoFinnishFrenchFrench American IndianFrench CanadianGermanGerman RussianGhanaianGreekGuamanian/ChamorroGuatemalanGuyaneseHaitianHmongHonduranHopiHoumaHungarianIcelanderIndian (Asian)IndonesianInupiatIranianIraqiIrishIroquoisIsraeliItalianJamaicanJapaneseJordanianKenyanKiowaKoreanLaotianLatvianLebaneseLiberianLithuanianLumbeeLuxembourgerMacedonianMalaysianMalteseMarshalleseMenomineeMexicanMexican American IndianMongolianMoroccanNative HawaiianNavajoNepaleseNew ZealanderNicaraguanNigerianNorthern EuropeanNorwegianOkinawanOsageOttawaPaiutePakistaniPalestinianPanamanianParaguayanPennsylvania GermanPeruvianPimaPolishPortuguesePotawatomiPuebloPuerto RicanPuget Sound SalishRomanianRussianSalvadoranSamoanScandinavianScotch-IrishScottishSeminoleSenegaleseSerbianShoshoneSierra LeoneanSiouxSlavicSlovakSloveneSomaliSouth AfricanSouth AmericanSouth American IndianSoviet UnionSpaniardSpanishSpanish AmericanSpanish American IndianSri LankanSubsaharan AfricanSudaneseSwedishSwissSyrianTaiwaneseThaiTlingit-HaidaTohono O'OdhamTonganTrinidadian and TobagonianTsimshianTurkishU.S. Virgin IslanderUgandanUkrainianUruguayanUteVenezuelanVietnameseWelshWest IndianYakamaYaquiYugoslavianYumanYup'ikZimbabwean
Immigration
NonimmigrantsImmigrantsAfghanistanAfricaAlbaniaArgentinaArmeniaAsiaAustraliaAustriaBahamasBangladeshBarbadosBelarusBelgiumBelizeBoliviaBosnia and HerzegovinaBrazilBulgariaBurma/MyanmarCabo VerdeCambodiaCameroonCanadaCaribbeanCentral AmericaChileChinaColombiaCongoCosta RicaCroatiaCubaCzechoslovakiaDenmarkDominicaDominican RepublicEastern AfricaEastern AsiaEastern EuropeEcuadorEgyptEl SalvadorEnglandEritreaEthiopiaEuropeFijiFranceGermanyGhanaGreeceGrenadaGuatemalaGuyanaHaitiHondurasHong KongHungaryIndiaIndonesiaIranIraqIrelandIsraelItalyJamaicaJapanJordanKazakhstanKenyaKoreaKuwaitLaosLatin AmericaLatviaLebanonLiberiaLithuaniaMalaysiaMexicoMicronesiaMiddle AfricaMoldovaMoroccoNepalNetherlandsNicaraguaNigeriaNorth AmericaNorth MacedoniaNorthern AfricaNorthern EuropeNorwayOceaniaPakistanPanamaPeruPhilippinesPolandPortugalRomaniaRussiaSaudi ArabiaScotlandSenegalSerbiaSierra LeoneSingaporeSomaliaSouth AfricaSouth AmericaSouth Central AsiaSouth Eastern AsiaSouthern EuropeSpainSri LankaSt. Vincent and the GrenadinesSudanSwedenSwitzerlandSyriaTaiwanThailandTrinidad and TobagoTurkeyUgandaUkraineUruguayUzbekistanVenezuelaVietnamWest IndiesWestern AfricaWestern AsiaWestern EuropeYemenZaireZimbabweAzores
Cree
Race
Ancestry
AfricanAlaska NativeAlaskan AthabascanAlbanianAleutAlsatianAmericanApacheArabArapahoArgentineanArmenianAssyrian/Chaldean/SyriacAustralianAustrianBahamianBangladeshiBarbadianBasqueBelgianBelizeanBermudanBhutaneseBlackfeetBolivianBrazilianBritishBritish West IndianBulgarianBurmeseCajunCambodianCanadianCape VerdeanCarpatho RusynCelticCentral AmericanCentral American IndianCherokeeCheyenneChickasawChileanChineseChippewaChoctawColombianColvilleComancheCosta RicanCreeCreekCroatianCrowCubanCypriotCzechCzechoslovakianDanishDelawareDominicanDutchDutch West IndianEastern EuropeanEcuadorianEgyptianEnglishEstonianEthiopianEuropeanFijianFilipinoFinnishFrenchFrench American IndianFrench CanadianGermanGerman RussianGhanaianGreekGuamanian/ChamorroGuatemalanGuyaneseHaitianHmongHonduranHopiHoumaHungarianIcelanderIndian (Asian)IndonesianInupiatIranianIraqiIrishIroquoisIsraeliItalianJamaicanJapaneseJordanianKenyanKiowaKoreanLaotianLatvianLebaneseLiberianLithuanianLumbeeLuxembourgerMacedonianMalaysianMalteseMarshalleseMenomineeMexicanMexican American IndianMongolianMoroccanNative HawaiianNavajoNepaleseNew ZealanderNicaraguanNigerianNorthern EuropeanNorwegianOkinawanOsageOttawaPaiutePakistaniPalestinianPanamanianParaguayanPennsylvania GermanPeruvianPimaPolishPortuguesePotawatomiPuebloPuerto RicanPuget Sound SalishRomanianRussianSalvadoranSamoanScandinavianScotch-IrishScottishSeminoleSenegaleseSerbianShoshoneSierra LeoneanSiouxSlavicSlovakSloveneSomaliSouth AfricanSouth AmericanSouth American IndianSoviet UnionSpaniardSpanishSpanish AmericanSpanish American IndianSri LankanSubsaharan AfricanSudaneseSwedishSwissSyrianTaiwaneseThaiTlingit-HaidaTohono O'OdhamTonganTrinidadian and TobagonianTsimshianTurkishU.S. Virgin IslanderUgandanUkrainianUruguayanUteVenezuelanVietnameseWelshWest IndianYakamaYaquiYugoslavianYumanYup'ikZimbabwean
Immigration
NonimmigrantsImmigrantsAfghanistanAfricaAlbaniaArgentinaArmeniaAsiaAustraliaAustriaBahamasBangladeshBarbadosBelarusBelgiumBelizeBoliviaBosnia and HerzegovinaBrazilBulgariaBurma/MyanmarCabo VerdeCambodiaCameroonCanadaCaribbeanCentral AmericaChileChinaColombiaCongoCosta RicaCroatiaCubaCzechoslovakiaDenmarkDominicaDominican RepublicEastern AfricaEastern AsiaEastern EuropeEcuadorEgyptEl SalvadorEnglandEritreaEthiopiaEuropeFijiFranceGermanyGhanaGreeceGrenadaGuatemalaGuyanaHaitiHondurasHong KongHungaryIndiaIndonesiaIranIraqIrelandIsraelItalyJamaicaJapanJordanKazakhstanKenyaKoreaKuwaitLaosLatin AmericaLatviaLebanonLiberiaLithuaniaMalaysiaMexicoMicronesiaMiddle AfricaMoldovaMoroccoNepalNetherlandsNicaraguaNigeriaNorth AmericaNorth MacedoniaNorthern AfricaNorthern EuropeNorwayOceaniaPakistanPanamaPeruPhilippinesPolandPortugalRomaniaRussiaSaudi ArabiaScotlandSenegalSerbiaSierra LeoneSingaporeSomaliaSouth AfricaSouth AmericaSouth Central AsiaSouth Eastern AsiaSouthern EuropeSpainSri LankaSt. Vincent and the GrenadinesSudanSwedenSwitzerlandSyriaTaiwanThailandTrinidad and TobagoTurkeyUgandaUkraineUruguayUzbekistanVenezuelaVietnamWest IndiesWestern AfricaWestern AsiaWestern EuropeYemenZaireZimbabweAzores
11th Grade
Income
Poverty
Unemployment
Labor Participation
Family Structure
Vehicle Availability
Education Level
Disability

11th Grade Comparison

Afghans

Cree

Poor
Excellent
92.1%
11TH GRADE
12.8/ 100
METRIC RATING
214th/ 347
METRIC RANK
92.9%
11TH GRADE
85.9/ 100
METRIC RATING
136th/ 347
METRIC RANK

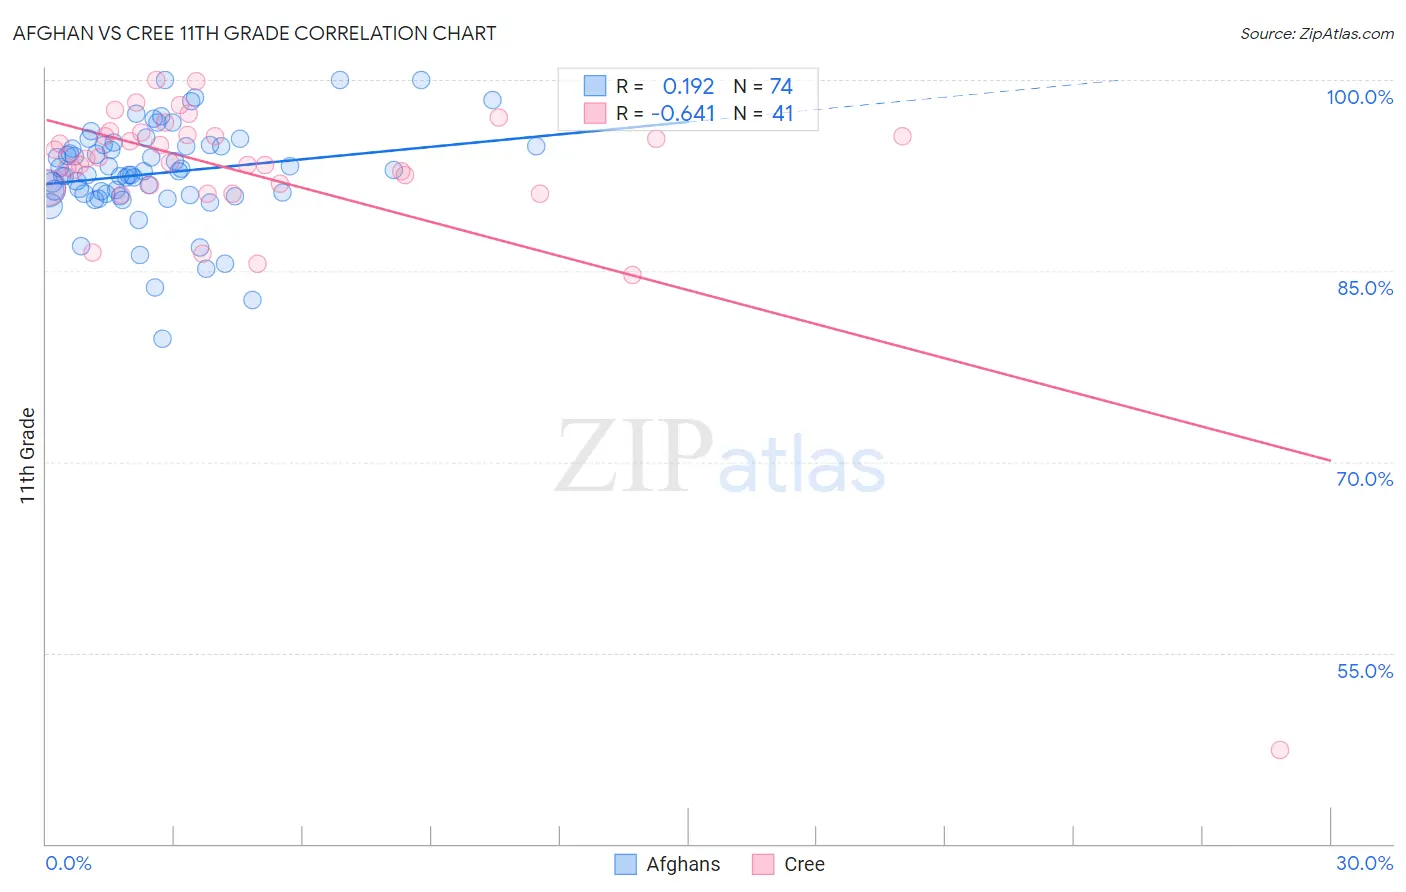
Afghan vs Cree 11th Grade Correlation Chart

The statistical analysis conducted on geographies consisting of 148,851,685 people shows a poor positive correlation between the proportion of Afghans and percentage of population with at least 11th grade education in the United States with a correlation coefficient (R) of 0.192 and weighted average of 92.1%. Similarly, the statistical analysis conducted on geographies consisting of 76,211,744 people shows a significant negative correlation between the proportion of Cree and percentage of population with at least 11th grade education in the United States with a correlation coefficient (R) of -0.641 and weighted average of 92.9%, a difference of 0.92%.
Afghan vs Cree 11th Grade

11th Grade Correlation Summary

MeasurementAfghanCree
Minimum79.7%47.4%
Maximum100.0%100.0%
Range20.3%52.6%
Mean92.7%92.6%
Median92.7%93.8%
Interquartile 25% (IQ1)91.0%91.6%
Interquartile 75% (IQ3)94.8%95.8%
Interquartile Range (IQR)3.8%4.2%
Standard Deviation (Sample)3.8%8.1%
Standard Deviation (Population)3.8%8.0%

Similar Demographics by 11th Grade

Demographics Similar to Afghans by 11th Grade

In terms of 11th grade, the demographic groups most similar to Afghans are Immigrants from Southern Europe (92.1%, a difference of 0.010%), Immigrants from Ethiopia (92.1%, a difference of 0.020%), Korean (92.1%, a difference of 0.030%), Somali (92.1%, a difference of 0.030%), and Immigrants from Sierra Leone (92.0%, a difference of 0.040%).
DemographicsRating | Rank11th Grade
Immigrants | Oceania
22.4
/100
|
#207
Fair
92.2%
Colville
21.8
/100
|
#208
Fair
92.2%
Tongans
19.8
/100
|
#209
Poor
92.2%
Ethiopians
18.8
/100
|
#210
Poor
92.2%
Immigrants | Micronesia
17.7
/100
|
#211
Poor
92.2%
Koreans
14.4
/100
|
#212
Poor
92.1%
Immigrants | Ethiopia
13.9
/100
|
#213
Poor
92.1%
Afghans
12.8
/100
|
#214
Poor
92.1%
Immigrants | Southern Europe
12.5
/100
|
#215
Poor
92.1%
Somalis
11.6
/100
|
#216
Poor
92.1%
Immigrants | Sierra Leone
11.1
/100
|
#217
Poor
92.0%
Blackfeet
10.1
/100
|
#218
Poor
92.0%
Portuguese
10.0
/100
|
#219
Tragic
92.0%
South American Indians
7.6
/100
|
#220
Tragic
92.0%
Immigrants | Liberia
7.0
/100
|
#221
Tragic
91.9%

Demographics Similar to Cree by 11th Grade

In terms of 11th grade, the demographic groups most similar to Cree are Immigrants from Italy (92.9%, a difference of 0.010%), Arab (92.9%, a difference of 0.010%), Immigrants from Brazil (92.9%, a difference of 0.020%), Mongolian (93.0%, a difference of 0.030%), and Delaware (93.0%, a difference of 0.030%).
DemographicsRating | Rank11th Grade
Immigrants | Ukraine
89.8
/100
|
#129
Excellent
93.0%
Albanians
89.5
/100
|
#130
Excellent
93.0%
Egyptians
89.5
/100
|
#131
Excellent
93.0%
Immigrants | Bosnia and Herzegovina
89.0
/100
|
#132
Excellent
93.0%
Mongolians
87.6
/100
|
#133
Excellent
93.0%
Delaware
87.3
/100
|
#134
Excellent
93.0%
Immigrants | Italy
86.6
/100
|
#135
Excellent
92.9%
Cree
85.9
/100
|
#136
Excellent
92.9%
Arabs
85.4
/100
|
#137
Excellent
92.9%
Immigrants | Brazil
85.1
/100
|
#138
Excellent
92.9%
Crow
84.1
/100
|
#139
Excellent
92.9%
Venezuelans
83.4
/100
|
#140
Excellent
92.9%
Chileans
83.0
/100
|
#141
Excellent
92.9%
Kenyans
82.0
/100
|
#142
Excellent
92.9%
Ugandans
81.4
/100
|
#143
Excellent
92.9%