Yup'ik vs Spanish American Disability Age Over 75
COMPARE
Yup'ik
Spanish American
Disability Age Over 75
Disability Age Over 75 Comparison
Yup'ik
Spanish Americans
61.1%
DISABILITY AGE OVER 75
0.0/ 100
METRIC RATING
347th/ 347
METRIC RANK
50.0%
DISABILITY AGE OVER 75
0.0/ 100
METRIC RATING
295th/ 347
METRIC RANK
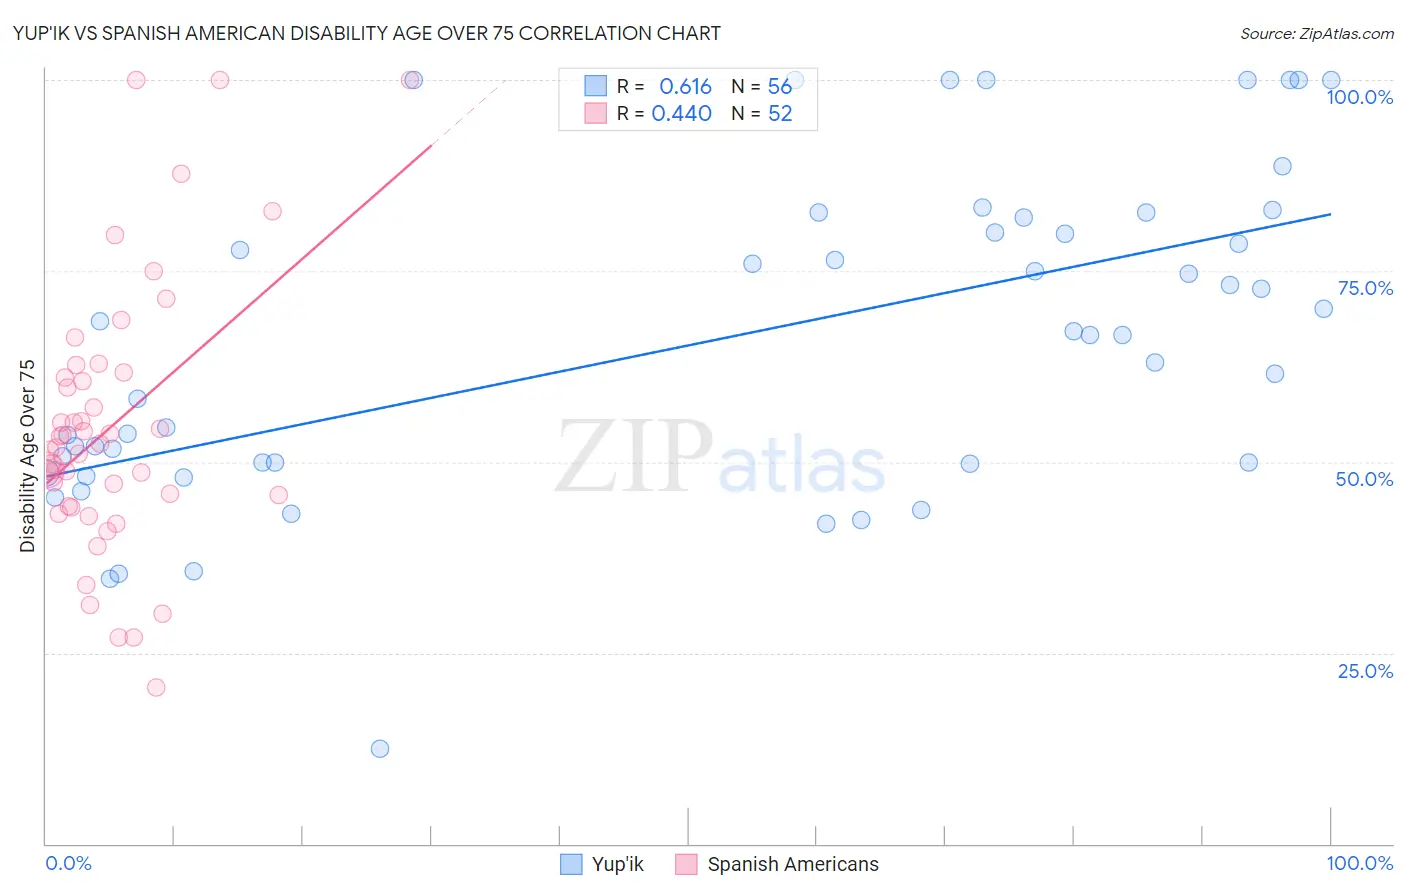
Yup'ik vs Spanish American Disability Age Over 75 Correlation Chart
The statistical analysis conducted on geographies consisting of 39,925,791 people shows a significant positive correlation between the proportion of Yup'ik and percentage of population with a disability over the age of 75 in the United States with a correlation coefficient (R) of 0.616 and weighted average of 61.1%. Similarly, the statistical analysis conducted on geographies consisting of 103,158,462 people shows a moderate positive correlation between the proportion of Spanish Americans and percentage of population with a disability over the age of 75 in the United States with a correlation coefficient (R) of 0.440 and weighted average of 50.0%, a difference of 22.2%.
Disability Age Over 75 Correlation Summary
| Measurement | Yup'ik | Spanish American |
| Minimum | 12.5% | 20.5% |
| Maximum | 100.0% | 100.0% |
| Range | 87.5% | 79.5% |
| Mean | 65.7% | 54.7% |
| Median | 66.7% | 52.1% |
| Interquartile 25% (IQ1) | 49.8% | 44.9% |
| Interquartile 75% (IQ3) | 81.0% | 61.4% |
| Interquartile Range (IQR) | 31.2% | 16.4% |
| Standard Deviation (Sample) | 21.0% | 17.6% |
| Standard Deviation (Population) | 20.8% | 17.5% |
Similar Demographics by Disability Age Over 75
Demographics Similar to Yup'ik by Disability Age Over 75
In terms of disability age over 75, the demographic groups most similar to Yup'ik are Tsimshian (59.2%, a difference of 3.2%), Inupiat (58.4%, a difference of 4.6%), Navajo (58.3%, a difference of 4.9%), Tohono O'odham (56.7%, a difference of 7.7%), and Lumbee (56.2%, a difference of 8.6%).
| Demographics | Rating | Rank | Disability Age Over 75 |
| Apache | 0.0 /100 | #333 | Tragic 53.6% |
| Alaskan Athabascans | 0.0 /100 | #334 | Tragic 54.0% |
| Kiowa | 0.0 /100 | #335 | Tragic 54.2% |
| Immigrants | Armenia | 0.0 /100 | #336 | Tragic 54.3% |
| Yuman | 0.0 /100 | #337 | Tragic 54.4% |
| Colville | 0.0 /100 | #338 | Tragic 55.4% |
| Pima | 0.0 /100 | #339 | Tragic 55.8% |
| Pueblo | 0.0 /100 | #340 | Tragic 55.9% |
| Houma | 0.0 /100 | #341 | Tragic 56.2% |
| Lumbee | 0.0 /100 | #342 | Tragic 56.2% |
| Tohono O'odham | 0.0 /100 | #343 | Tragic 56.7% |
| Navajo | 0.0 /100 | #344 | Tragic 58.3% |
| Inupiat | 0.0 /100 | #345 | Tragic 58.4% |
| Tsimshian | 0.0 /100 | #346 | Tragic 59.2% |
| Yup'ik | 0.0 /100 | #347 | Tragic 61.1% |
Demographics Similar to Spanish Americans by Disability Age Over 75
In terms of disability age over 75, the demographic groups most similar to Spanish Americans are Immigrants from Cambodia (50.0%, a difference of 0.040%), Mexican American Indian (50.0%, a difference of 0.040%), Armenian (50.0%, a difference of 0.060%), Marshallese (50.1%, a difference of 0.12%), and Spanish American Indian (49.9%, a difference of 0.16%).
| Demographics | Rating | Rank | Disability Age Over 75 |
| Yaqui | 0.0 /100 | #288 | Tragic 49.8% |
| Osage | 0.0 /100 | #289 | Tragic 49.8% |
| Puget Sound Salish | 0.0 /100 | #290 | Tragic 49.8% |
| Arapaho | 0.0 /100 | #291 | Tragic 49.8% |
| Shoshone | 0.0 /100 | #292 | Tragic 49.9% |
| Spanish American Indians | 0.0 /100 | #293 | Tragic 49.9% |
| Immigrants | Cambodia | 0.0 /100 | #294 | Tragic 50.0% |
| Spanish Americans | 0.0 /100 | #295 | Tragic 50.0% |
| Mexican American Indians | 0.0 /100 | #296 | Tragic 50.0% |
| Armenians | 0.0 /100 | #297 | Tragic 50.0% |
| Marshallese | 0.0 /100 | #298 | Tragic 50.1% |
| Immigrants | Micronesia | 0.0 /100 | #299 | Tragic 50.1% |
| Cape Verdeans | 0.0 /100 | #300 | Tragic 50.1% |
| Dominicans | 0.0 /100 | #301 | Tragic 50.2% |
| Cherokee | 0.0 /100 | #302 | Tragic 50.2% |