Yaqui vs Tohono O'odham Disability Age Over 75
COMPARE
Yaqui
Tohono O'odham
Disability Age Over 75
Disability Age Over 75 Comparison
Yaqui
Tohono O'odham
49.8%
DISABILITY AGE OVER 75
0.0/ 100
METRIC RATING
288th/ 347
METRIC RANK
56.7%
DISABILITY AGE OVER 75
0.0/ 100
METRIC RATING
343rd/ 347
METRIC RANK
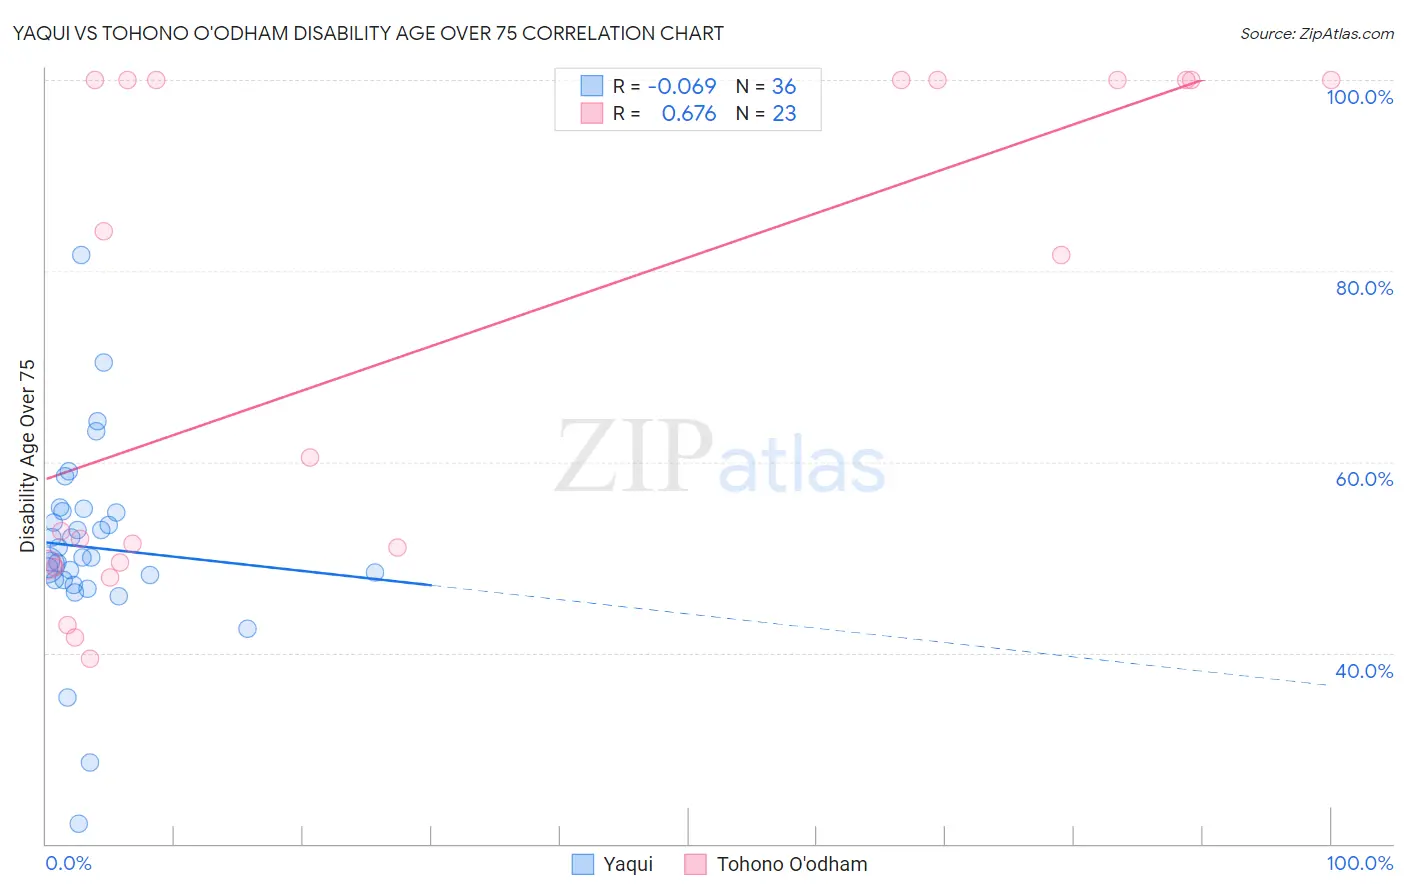
Yaqui vs Tohono O'odham Disability Age Over 75 Correlation Chart
The statistical analysis conducted on geographies consisting of 107,650,566 people shows a slight negative correlation between the proportion of Yaqui and percentage of population with a disability over the age of 75 in the United States with a correlation coefficient (R) of -0.069 and weighted average of 49.8%. Similarly, the statistical analysis conducted on geographies consisting of 58,667,406 people shows a significant positive correlation between the proportion of Tohono O'odham and percentage of population with a disability over the age of 75 in the United States with a correlation coefficient (R) of 0.676 and weighted average of 56.7%, a difference of 14.0%.
Disability Age Over 75 Correlation Summary
| Measurement | Yaqui | Tohono O'odham |
| Minimum | 22.1% | 39.4% |
| Maximum | 81.7% | 100.0% |
| Range | 59.5% | 60.6% |
| Mean | 51.0% | 71.9% |
| Median | 50.0% | 60.4% |
| Interquartile 25% (IQ1) | 47.6% | 49.2% |
| Interquartile 75% (IQ3) | 54.8% | 100.0% |
| Interquartile Range (IQR) | 7.1% | 50.8% |
| Standard Deviation (Sample) | 10.2% | 25.3% |
| Standard Deviation (Population) | 10.1% | 24.7% |
Similar Demographics by Disability Age Over 75
Demographics Similar to Yaqui by Disability Age Over 75
In terms of disability age over 75, the demographic groups most similar to Yaqui are Sioux (49.7%, a difference of 0.050%), Osage (49.8%, a difference of 0.080%), Puget Sound Salish (49.8%, a difference of 0.090%), Arapaho (49.8%, a difference of 0.090%), and Shoshone (49.9%, a difference of 0.16%).
| Demographics | Rating | Rank | Disability Age Over 75 |
| Belizeans | 0.0 /100 | #281 | Tragic 49.4% |
| Blacks/African Americans | 0.0 /100 | #282 | Tragic 49.5% |
| Samoans | 0.0 /100 | #283 | Tragic 49.5% |
| Immigrants | Latin America | 0.0 /100 | #284 | Tragic 49.5% |
| Crow | 0.0 /100 | #285 | Tragic 49.6% |
| Immigrants | Belize | 0.0 /100 | #286 | Tragic 49.6% |
| Sioux | 0.0 /100 | #287 | Tragic 49.7% |
| Yaqui | 0.0 /100 | #288 | Tragic 49.8% |
| Osage | 0.0 /100 | #289 | Tragic 49.8% |
| Puget Sound Salish | 0.0 /100 | #290 | Tragic 49.8% |
| Arapaho | 0.0 /100 | #291 | Tragic 49.8% |
| Shoshone | 0.0 /100 | #292 | Tragic 49.9% |
| Spanish American Indians | 0.0 /100 | #293 | Tragic 49.9% |
| Immigrants | Cambodia | 0.0 /100 | #294 | Tragic 50.0% |
| Spanish Americans | 0.0 /100 | #295 | Tragic 50.0% |
Demographics Similar to Tohono O'odham by Disability Age Over 75
In terms of disability age over 75, the demographic groups most similar to Tohono O'odham are Lumbee (56.2%, a difference of 0.83%), Houma (56.2%, a difference of 1.0%), Pueblo (55.9%, a difference of 1.5%), Pima (55.8%, a difference of 1.6%), and Colville (55.4%, a difference of 2.4%).
| Demographics | Rating | Rank | Disability Age Over 75 |
| Apache | 0.0 /100 | #333 | Tragic 53.6% |
| Alaskan Athabascans | 0.0 /100 | #334 | Tragic 54.0% |
| Kiowa | 0.0 /100 | #335 | Tragic 54.2% |
| Immigrants | Armenia | 0.0 /100 | #336 | Tragic 54.3% |
| Yuman | 0.0 /100 | #337 | Tragic 54.4% |
| Colville | 0.0 /100 | #338 | Tragic 55.4% |
| Pima | 0.0 /100 | #339 | Tragic 55.8% |
| Pueblo | 0.0 /100 | #340 | Tragic 55.9% |
| Houma | 0.0 /100 | #341 | Tragic 56.2% |
| Lumbee | 0.0 /100 | #342 | Tragic 56.2% |
| Tohono O'odham | 0.0 /100 | #343 | Tragic 56.7% |
| Navajo | 0.0 /100 | #344 | Tragic 58.3% |
| Inupiat | 0.0 /100 | #345 | Tragic 58.4% |
| Tsimshian | 0.0 /100 | #346 | Tragic 59.2% |
| Yup'ik | 0.0 /100 | #347 | Tragic 61.1% |