Ute vs Immigrants from Brazil Ambulatory Disability

COMPARE

Ute
Race
Ancestry
AfghanAfricanAlaska NativeAlaskan AthabascanAlbanianAleutAlsatianAmericanApacheArabArapahoArgentineanArmenianAssyrian/Chaldean/SyriacAustralianAustrianBahamianBangladeshiBarbadianBasqueBelgianBelizeanBermudanBhutaneseBlackfeetBolivianBrazilianBritishBritish West IndianBulgarianBurmeseCajunCambodianCanadianCape VerdeanCarpatho RusynCelticCentral AmericanCentral American IndianCherokeeCheyenneChickasawChileanChineseChippewaChoctawColombianColvilleComancheCosta RicanCreeCreekCroatianCrowCubanCypriotCzechCzechoslovakianDanishDelawareDominicanDutchDutch West IndianEastern EuropeanEcuadorianEgyptianEnglishEstonianEthiopianEuropeanFijianFilipinoFinnishFrenchFrench American IndianFrench CanadianGermanGerman RussianGhanaianGreekGuamanian/ChamorroGuatemalanGuyaneseHaitianHmongHonduranHopiHoumaHungarianIcelanderIndian (Asian)IndonesianInupiatIranianIraqiIrishIroquoisIsraeliItalianJamaicanJapaneseJordanianKenyanKiowaKoreanLaotianLatvianLebaneseLiberianLithuanianLumbeeLuxembourgerMacedonianMalaysianMalteseMarshalleseMenomineeMexicanMexican American IndianMongolianMoroccanNative HawaiianNavajoNepaleseNew ZealanderNicaraguanNigerianNorthern EuropeanNorwegianOkinawanOsageOttawaPaiutePakistaniPalestinianPanamanianParaguayanPennsylvania GermanPeruvianPimaPolishPortuguesePotawatomiPuebloPuerto RicanPuget Sound SalishRomanianRussianSalvadoranSamoanScandinavianScotch-IrishScottishSeminoleSenegaleseSerbianShoshoneSierra LeoneanSiouxSlavicSlovakSloveneSomaliSouth AfricanSouth AmericanSouth American IndianSoviet UnionSpaniardSpanishSpanish AmericanSpanish American IndianSri LankanSubsaharan AfricanSudaneseSwedishSwissSyrianTaiwaneseThaiTlingit-HaidaTohono O'OdhamTonganTrinidadian and TobagonianTsimshianTurkishU.S. Virgin IslanderUgandanUkrainianUruguayanUteVenezuelanVietnameseWelshWest IndianYakamaYaquiYugoslavianYumanYup'ikZimbabwean
Immigration
NonimmigrantsImmigrantsAfghanistanAfricaAlbaniaArgentinaArmeniaAsiaAustraliaAustriaBahamasBangladeshBarbadosBelarusBelgiumBelizeBoliviaBosnia and HerzegovinaBulgariaBurma/MyanmarCabo VerdeCambodiaCameroonCanadaCaribbeanCentral AmericaChileChinaColombiaCongoCosta RicaCroatiaCubaCzechoslovakiaDenmarkDominicaDominican RepublicEastern AfricaEastern AsiaEastern EuropeEcuadorEgyptEl SalvadorEnglandEritreaEthiopiaEuropeFijiFranceGermanyGhanaGreeceGrenadaGuatemalaGuyanaHaitiHondurasHong KongHungaryIndiaIndonesiaIranIraqIrelandIsraelItalyJamaicaJapanJordanKazakhstanKenyaKoreaKuwaitLaosLatin AmericaLatviaLebanonLiberiaLithuaniaMalaysiaMexicoMicronesiaMiddle AfricaMoldovaMoroccoNepalNetherlandsNicaraguaNigeriaNorth AmericaNorth MacedoniaNorthern AfricaNorthern EuropeNorwayOceaniaPakistanPanamaPeruPhilippinesPolandPortugalRomaniaRussiaSaudi ArabiaScotlandSenegalSerbiaSierra LeoneSingaporeSomaliaSouth AfricaSouth AmericaSouth Central AsiaSouth Eastern AsiaSouthern EuropeSpainSri LankaSt. Vincent and the GrenadinesSudanSwedenSwitzerlandSyriaTaiwanThailandTrinidad and TobagoTurkeyUgandaUkraineUruguayUzbekistanVenezuelaVietnamWest IndiesWestern AfricaWestern AsiaWestern EuropeYemenZaireZimbabweAzores
Immigrants from Brazil
Race
Ancestry
AfghanAfricanAlaska NativeAlaskan AthabascanAlbanianAleutAlsatianAmericanApacheArabArapahoArgentineanArmenianAssyrian/Chaldean/SyriacAustralianAustrianBahamianBangladeshiBarbadianBasqueBelgianBelizeanBermudanBhutaneseBlackfeetBolivianBrazilianBritishBritish West IndianBulgarianBurmeseCajunCambodianCanadianCape VerdeanCarpatho RusynCelticCentral AmericanCentral American IndianCherokeeCheyenneChickasawChileanChineseChippewaChoctawColombianColvilleComancheCosta RicanCreeCreekCroatianCrowCubanCypriotCzechCzechoslovakianDanishDelawareDominicanDutchDutch West IndianEastern EuropeanEcuadorianEgyptianEnglishEstonianEthiopianEuropeanFijianFilipinoFinnishFrenchFrench American IndianFrench CanadianGermanGerman RussianGhanaianGreekGuamanian/ChamorroGuatemalanGuyaneseHaitianHmongHonduranHopiHoumaHungarianIcelanderIndian (Asian)IndonesianInupiatIranianIraqiIrishIroquoisIsraeliItalianJamaicanJapaneseJordanianKenyanKiowaKoreanLaotianLatvianLebaneseLiberianLithuanianLumbeeLuxembourgerMacedonianMalaysianMalteseMarshalleseMenomineeMexicanMexican American IndianMongolianMoroccanNative HawaiianNavajoNepaleseNew ZealanderNicaraguanNigerianNorthern EuropeanNorwegianOkinawanOsageOttawaPaiutePakistaniPalestinianPanamanianParaguayanPennsylvania GermanPeruvianPimaPolishPortuguesePotawatomiPuebloPuerto RicanPuget Sound SalishRomanianRussianSalvadoranSamoanScandinavianScotch-IrishScottishSeminoleSenegaleseSerbianShoshoneSierra LeoneanSiouxSlavicSlovakSloveneSomaliSouth AfricanSouth AmericanSouth American IndianSoviet UnionSpaniardSpanishSpanish AmericanSpanish American IndianSri LankanSubsaharan AfricanSudaneseSwedishSwissSyrianTaiwaneseThaiTlingit-HaidaTohono O'OdhamTonganTrinidadian and TobagonianTsimshianTurkishU.S. Virgin IslanderUgandanUkrainianUruguayanVenezuelanVietnameseWelshWest IndianYakamaYaquiYugoslavianYumanYup'ikZimbabwean
Immigration
NonimmigrantsImmigrantsAfghanistanAfricaAlbaniaArgentinaArmeniaAsiaAustraliaAustriaBahamasBangladeshBarbadosBelarusBelgiumBelizeBoliviaBosnia and HerzegovinaBrazilBulgariaBurma/MyanmarCabo VerdeCambodiaCameroonCanadaCaribbeanCentral AmericaChileChinaColombiaCongoCosta RicaCroatiaCubaCzechoslovakiaDenmarkDominicaDominican RepublicEastern AfricaEastern AsiaEastern EuropeEcuadorEgyptEl SalvadorEnglandEritreaEthiopiaEuropeFijiFranceGermanyGhanaGreeceGrenadaGuatemalaGuyanaHaitiHondurasHong KongHungaryIndiaIndonesiaIranIraqIrelandIsraelItalyJamaicaJapanJordanKazakhstanKenyaKoreaKuwaitLaosLatin AmericaLatviaLebanonLiberiaLithuaniaMalaysiaMexicoMicronesiaMiddle AfricaMoldovaMoroccoNepalNetherlandsNicaraguaNigeriaNorth AmericaNorth MacedoniaNorthern AfricaNorthern EuropeNorwayOceaniaPakistanPanamaPeruPhilippinesPolandPortugalRomaniaRussiaSaudi ArabiaScotlandSenegalSerbiaSierra LeoneSingaporeSomaliaSouth AfricaSouth AmericaSouth Central AsiaSouth Eastern AsiaSouthern EuropeSpainSri LankaSt. Vincent and the GrenadinesSudanSwedenSwitzerlandSyriaTaiwanThailandTrinidad and TobagoTurkeyUgandaUkraineUruguayUzbekistanVenezuelaVietnamWest IndiesWestern AfricaWestern AsiaWestern EuropeYemenZaireZimbabweAzores
Ambulatory Disability
Income
Poverty
Unemployment
Labor Participation
Family Structure
Vehicle Availability
Education Level
Disability

Ambulatory Disability Comparison

Ute

Immigrants from Brazil

Excellent
Exceptional
6.0%
AMBULATORY DISABILITY
86.6/ 100
METRIC RATING
134th/ 347
METRIC RANK
5.6%
AMBULATORY DISABILITY
99.8/ 100
METRIC RATING
57th/ 347
METRIC RANK

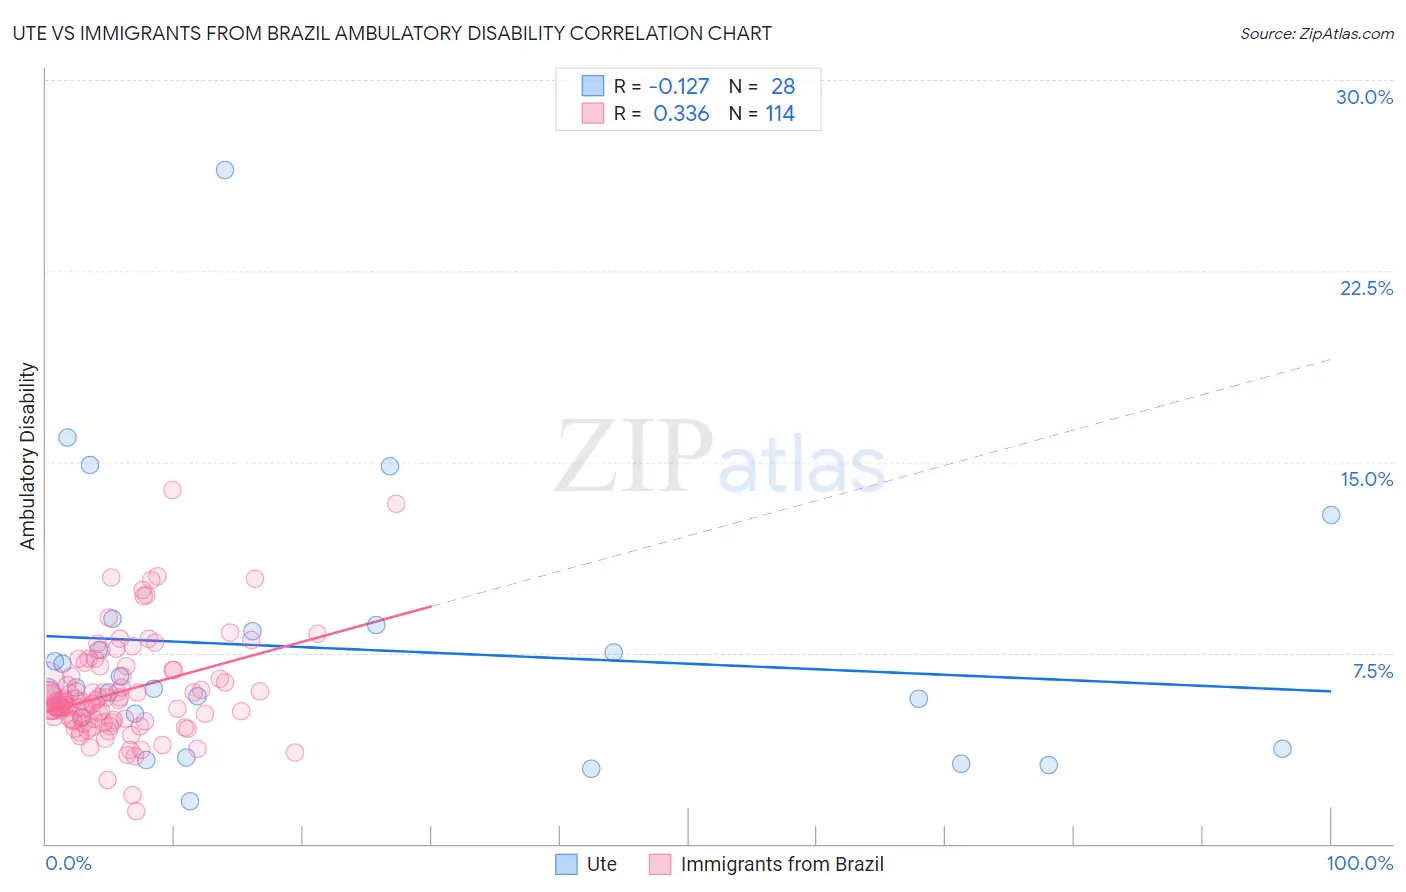
Ute vs Immigrants from Brazil Ambulatory Disability Correlation Chart

The statistical analysis conducted on geographies consisting of 55,667,207 people shows a poor negative correlation between the proportion of Ute and percentage of population with ambulatory disability in the United States with a correlation coefficient (R) of -0.127 and weighted average of 6.0%. Similarly, the statistical analysis conducted on geographies consisting of 342,966,003 people shows a mild positive correlation between the proportion of Immigrants from Brazil and percentage of population with ambulatory disability in the United States with a correlation coefficient (R) of 0.336 and weighted average of 5.6%, a difference of 6.1%.
Ute vs Immigrants from Brazil Ambulatory Disability

Ambulatory Disability Correlation Summary

MeasurementUteImmigrants from Brazil
Minimum1.7%1.3%
Maximum26.5%13.9%
Range24.8%12.6%
Mean7.6%6.0%
Median6.1%5.6%
Interquartile 25% (IQ1)4.3%4.8%
Interquartile 75% (IQ3)8.5%6.6%
Interquartile Range (IQR)4.1%1.8%
Standard Deviation (Sample)5.2%2.0%
Standard Deviation (Population)5.1%2.0%

Similar Demographics by Ambulatory Disability

Demographics Similar to Ute by Ambulatory Disability

In terms of ambulatory disability, the demographic groups most similar to Ute are Immigrants (6.0%, a difference of 0.040%), Immigrants from Europe (6.0%, a difference of 0.15%), Immigrants from Italy (6.0%, a difference of 0.18%), Immigrants from North Macedonia (6.0%, a difference of 0.27%), and Immigrants from Syria (6.0%, a difference of 0.27%).
DemographicsRating | RankAmbulatory Disability
Immigrants | Nigeria
90.9
/100
|
#127
Exceptional
5.9%
Immigrants | Western Asia
90.7
/100
|
#128
Exceptional
5.9%
Immigrants | Norway
90.5
/100
|
#129
Exceptional
5.9%
Immigrants | Kazakhstan
89.7
/100
|
#130
Excellent
5.9%
Immigrants | Costa Rica
89.5
/100
|
#131
Excellent
5.9%
Immigrants | Europe
87.8
/100
|
#132
Excellent
6.0%
Immigrants | Immigrants
86.9
/100
|
#133
Excellent
6.0%
Ute
86.6
/100
|
#134
Excellent
6.0%
Immigrants | Italy
85.0
/100
|
#135
Excellent
6.0%
Immigrants | North Macedonia
84.1
/100
|
#136
Excellent
6.0%
Immigrants | Syria
84.1
/100
|
#137
Excellent
6.0%
Immigrants | Hungary
83.9
/100
|
#138
Excellent
6.0%
Immigrants | Zaire
83.6
/100
|
#139
Excellent
6.0%
Czechs
83.3
/100
|
#140
Excellent
6.0%
Swedes
83.1
/100
|
#141
Excellent
6.0%

Demographics Similar to Immigrants from Brazil by Ambulatory Disability

In terms of ambulatory disability, the demographic groups most similar to Immigrants from Brazil are Immigrants from Zimbabwe (5.6%, a difference of 0.060%), Immigrants from Afghanistan (5.6%, a difference of 0.10%), Immigrants from Lithuania (5.6%, a difference of 0.14%), Inupiat (5.6%, a difference of 0.24%), and Immigrants from Belgium (5.6%, a difference of 0.26%).
DemographicsRating | RankAmbulatory Disability
Luxembourgers
99.9
/100
|
#50
Exceptional
5.6%
Taiwanese
99.8
/100
|
#51
Exceptional
5.6%
Jordanians
99.8
/100
|
#52
Exceptional
5.6%
Immigrants | Egypt
99.8
/100
|
#53
Exceptional
5.6%
Immigrants | Eastern Africa
99.8
/100
|
#54
Exceptional
5.6%
Immigrants | Bulgaria
99.8
/100
|
#55
Exceptional
5.6%
Inupiat
99.8
/100
|
#56
Exceptional
5.6%
Immigrants | Brazil
99.8
/100
|
#57
Exceptional
5.6%
Immigrants | Zimbabwe
99.8
/100
|
#58
Exceptional
5.6%
Immigrants | Afghanistan
99.8
/100
|
#59
Exceptional
5.6%
Immigrants | Lithuania
99.8
/100
|
#60
Exceptional
5.6%
Immigrants | Belgium
99.7
/100
|
#61
Exceptional
5.6%
Immigrants | Spain
99.7
/100
|
#62
Exceptional
5.6%
Immigrants | France
99.7
/100
|
#63
Exceptional
5.6%
Laotians
99.7
/100
|
#64
Exceptional
5.7%