Uruguayan vs Somali Disability Age 65 to 74
COMPARE
Uruguayan
Somali
Disability Age 65 to 74
Disability Age 65 to 74 Comparison
Uruguayans
Somalis
22.2%
DISABILITY AGE 65 TO 74
96.5/ 100
METRIC RATING
100th/ 347
METRIC RANK
25.1%
DISABILITY AGE 65 TO 74
0.6/ 100
METRIC RATING
254th/ 347
METRIC RANK
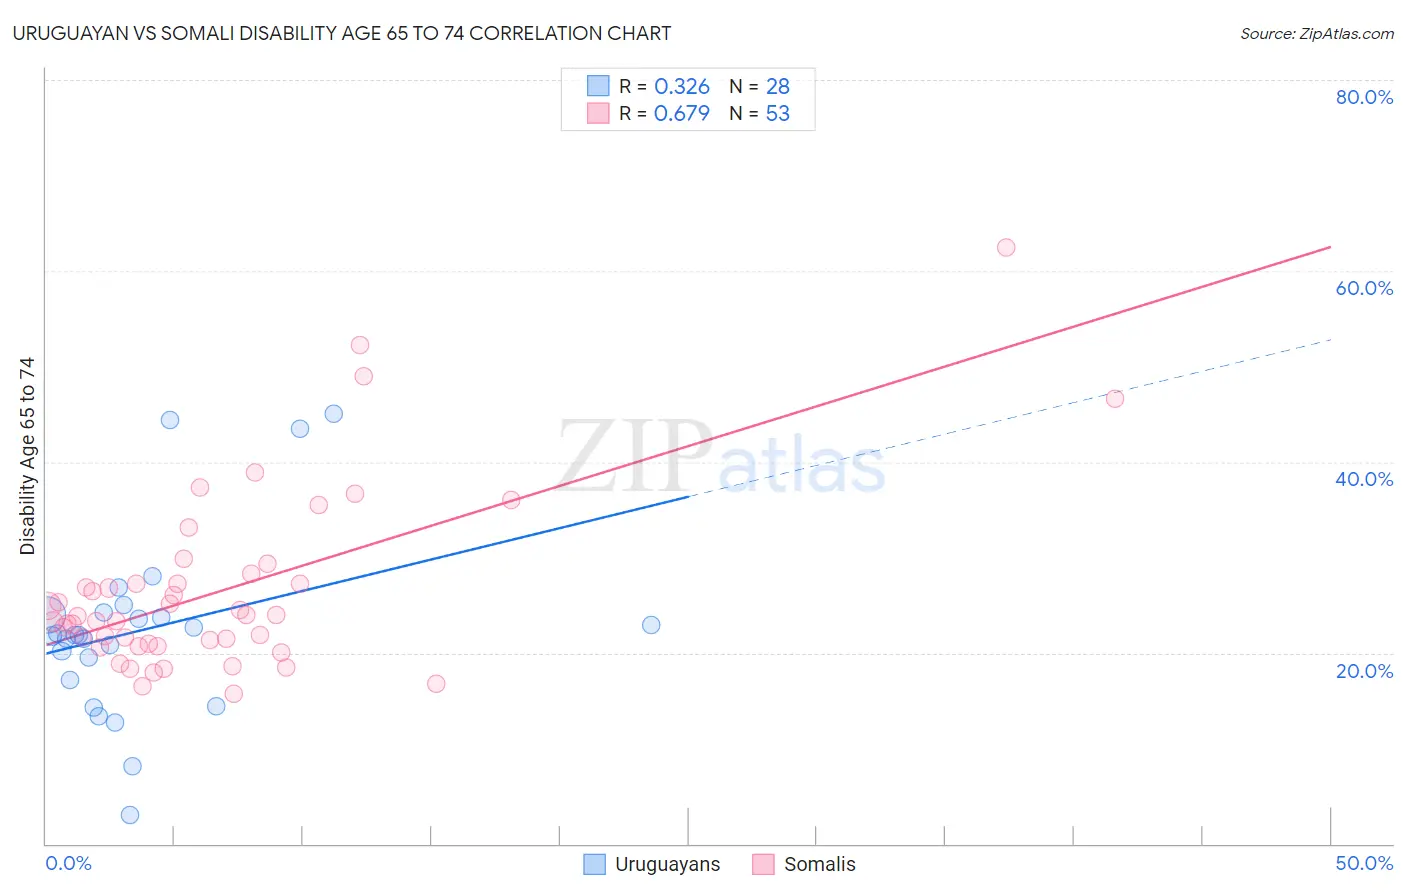
Uruguayan vs Somali Disability Age 65 to 74 Correlation Chart
The statistical analysis conducted on geographies consisting of 144,726,285 people shows a mild positive correlation between the proportion of Uruguayans and percentage of population with a disability between the ages 65 and 75 in the United States with a correlation coefficient (R) of 0.326 and weighted average of 22.2%. Similarly, the statistical analysis conducted on geographies consisting of 99,200,116 people shows a significant positive correlation between the proportion of Somalis and percentage of population with a disability between the ages 65 and 75 in the United States with a correlation coefficient (R) of 0.679 and weighted average of 25.1%, a difference of 13.0%.
Disability Age 65 to 74 Correlation Summary
| Measurement | Uruguayan | Somali |
| Minimum | 3.0% | 15.7% |
| Maximum | 45.0% | 62.5% |
| Range | 42.0% | 46.8% |
| Mean | 22.4% | 26.5% |
| Median | 21.8% | 23.8% |
| Interquartile 25% (IQ1) | 18.3% | 20.9% |
| Interquartile 75% (IQ3) | 24.1% | 27.8% |
| Interquartile Range (IQR) | 5.8% | 6.9% |
| Standard Deviation (Sample) | 9.5% | 9.4% |
| Standard Deviation (Population) | 9.3% | 9.3% |
Similar Demographics by Disability Age 65 to 74
Demographics Similar to Uruguayans by Disability Age 65 to 74
In terms of disability age 65 to 74, the demographic groups most similar to Uruguayans are Immigrants from England (22.2%, a difference of 0.020%), Immigrants from Saudi Arabia (22.2%, a difference of 0.040%), South American (22.2%, a difference of 0.060%), Colombian (22.2%, a difference of 0.070%), and Palestinian (22.2%, a difference of 0.12%).
| Demographics | Rating | Rank | Disability Age 65 to 74 |
| Immigrants | Canada | 97.8 /100 | #93 | Exceptional 22.1% |
| Immigrants | Chile | 97.7 /100 | #94 | Exceptional 22.1% |
| Romanians | 97.7 /100 | #95 | Exceptional 22.1% |
| Immigrants | North America | 97.5 /100 | #96 | Exceptional 22.1% |
| Immigrants | Southern Europe | 97.2 /100 | #97 | Exceptional 22.1% |
| Jordanians | 96.9 /100 | #98 | Exceptional 22.2% |
| Immigrants | Colombia | 96.8 /100 | #99 | Exceptional 22.2% |
| Uruguayans | 96.5 /100 | #100 | Exceptional 22.2% |
| Immigrants | England | 96.5 /100 | #101 | Exceptional 22.2% |
| Immigrants | Saudi Arabia | 96.4 /100 | #102 | Exceptional 22.2% |
| South Americans | 96.4 /100 | #103 | Exceptional 22.2% |
| Colombians | 96.4 /100 | #104 | Exceptional 22.2% |
| Palestinians | 96.3 /100 | #105 | Exceptional 22.2% |
| Peruvians | 96.1 /100 | #106 | Exceptional 22.2% |
| Slovenes | 96.1 /100 | #107 | Exceptional 22.2% |
Demographics Similar to Somalis by Disability Age 65 to 74
In terms of disability age 65 to 74, the demographic groups most similar to Somalis are Subsaharan African (25.1%, a difference of 0.080%), Immigrants from El Salvador (25.1%, a difference of 0.11%), Central American (25.1%, a difference of 0.16%), Nonimmigrants (25.0%, a difference of 0.30%), and Salvadoran (25.0%, a difference of 0.50%).
| Demographics | Rating | Rank | Disability Age 65 to 74 |
| Indonesians | 1.1 /100 | #247 | Tragic 24.9% |
| Senegalese | 0.9 /100 | #248 | Tragic 24.9% |
| Immigrants | Fiji | 0.8 /100 | #249 | Tragic 25.0% |
| Salvadorans | 0.8 /100 | #250 | Tragic 25.0% |
| Immigrants | Nonimmigrants | 0.7 /100 | #251 | Tragic 25.0% |
| Immigrants | El Salvador | 0.6 /100 | #252 | Tragic 25.1% |
| Sub-Saharan Africans | 0.6 /100 | #253 | Tragic 25.1% |
| Somalis | 0.6 /100 | #254 | Tragic 25.1% |
| Central Americans | 0.5 /100 | #255 | Tragic 25.1% |
| Immigrants | Somalia | 0.4 /100 | #256 | Tragic 25.2% |
| Guamanians/Chamorros | 0.3 /100 | #257 | Tragic 25.3% |
| Marshallese | 0.3 /100 | #258 | Tragic 25.3% |
| Immigrants | Cambodia | 0.3 /100 | #259 | Tragic 25.3% |
| Malaysians | 0.2 /100 | #260 | Tragic 25.4% |
| Cape Verdeans | 0.2 /100 | #261 | Tragic 25.4% |