Slovene vs Immigrants from Kuwait Ambulatory Disability

COMPARE

Slovene
Race
Ancestry
AfghanAfricanAlaska NativeAlaskan AthabascanAlbanianAleutAlsatianAmericanApacheArabArapahoArgentineanArmenianAssyrian/Chaldean/SyriacAustralianAustrianBahamianBangladeshiBarbadianBasqueBelgianBelizeanBermudanBhutaneseBlackfeetBolivianBrazilianBritishBritish West IndianBulgarianBurmeseCajunCambodianCanadianCape VerdeanCarpatho RusynCelticCentral AmericanCentral American IndianCherokeeCheyenneChickasawChileanChineseChippewaChoctawColombianColvilleComancheCosta RicanCreeCreekCroatianCrowCubanCypriotCzechCzechoslovakianDanishDelawareDominicanDutchDutch West IndianEastern EuropeanEcuadorianEgyptianEnglishEstonianEthiopianEuropeanFijianFilipinoFinnishFrenchFrench American IndianFrench CanadianGermanGerman RussianGhanaianGreekGuamanian/ChamorroGuatemalanGuyaneseHaitianHmongHonduranHopiHoumaHungarianIcelanderIndian (Asian)IndonesianInupiatIranianIraqiIrishIroquoisIsraeliItalianJamaicanJapaneseJordanianKenyanKiowaKoreanLaotianLatvianLebaneseLiberianLithuanianLumbeeLuxembourgerMacedonianMalaysianMalteseMarshalleseMenomineeMexicanMexican American IndianMongolianMoroccanNative HawaiianNavajoNepaleseNew ZealanderNicaraguanNigerianNorthern EuropeanNorwegianOkinawanOsageOttawaPaiutePakistaniPalestinianPanamanianParaguayanPennsylvania GermanPeruvianPimaPolishPortuguesePotawatomiPuebloPuerto RicanPuget Sound SalishRomanianRussianSalvadoranSamoanScandinavianScotch-IrishScottishSeminoleSenegaleseSerbianShoshoneSierra LeoneanSiouxSlavicSlovakSloveneSomaliSouth AfricanSouth AmericanSouth American IndianSoviet UnionSpaniardSpanishSpanish AmericanSpanish American IndianSri LankanSubsaharan AfricanSudaneseSwedishSwissSyrianTaiwaneseThaiTlingit-HaidaTohono O'OdhamTonganTrinidadian and TobagonianTsimshianTurkishU.S. Virgin IslanderUgandanUkrainianUruguayanUteVenezuelanVietnameseWelshWest IndianYakamaYaquiYugoslavianYumanYup'ikZimbabwean
Immigration
NonimmigrantsImmigrantsAfghanistanAfricaAlbaniaArgentinaArmeniaAsiaAustraliaAustriaBahamasBangladeshBarbadosBelarusBelgiumBelizeBoliviaBosnia and HerzegovinaBrazilBulgariaBurma/MyanmarCabo VerdeCambodiaCameroonCanadaCaribbeanCentral AmericaChileChinaColombiaCongoCosta RicaCroatiaCubaCzechoslovakiaDenmarkDominicaDominican RepublicEastern AfricaEastern AsiaEastern EuropeEcuadorEgyptEl SalvadorEnglandEritreaEthiopiaEuropeFijiFranceGermanyGhanaGreeceGrenadaGuatemalaGuyanaHaitiHondurasHong KongHungaryIndiaIndonesiaIranIraqIrelandIsraelItalyJamaicaJapanJordanKazakhstanKenyaKoreaLaosLatin AmericaLatviaLebanonLiberiaLithuaniaMalaysiaMexicoMicronesiaMiddle AfricaMoldovaMoroccoNepalNetherlandsNicaraguaNigeriaNorth AmericaNorth MacedoniaNorthern AfricaNorthern EuropeNorwayOceaniaPakistanPanamaPeruPhilippinesPolandPortugalRomaniaRussiaSaudi ArabiaScotlandSenegalSerbiaSierra LeoneSingaporeSomaliaSouth AfricaSouth AmericaSouth Central AsiaSouth Eastern AsiaSouthern EuropeSpainSri LankaSt. Vincent and the GrenadinesSudanSwedenSwitzerlandSyriaTaiwanThailandTrinidad and TobagoTurkeyUgandaUkraineUruguayUzbekistanVenezuelaVietnamWest IndiesWestern AfricaWestern AsiaWestern EuropeYemenZaireZimbabweAzores
Immigrants from Kuwait
Race
Ancestry
AfghanAfricanAlaska NativeAlaskan AthabascanAlbanianAleutAlsatianAmericanApacheArabArapahoArgentineanArmenianAssyrian/Chaldean/SyriacAustralianAustrianBahamianBangladeshiBarbadianBasqueBelgianBelizeanBermudanBhutaneseBlackfeetBolivianBrazilianBritishBritish West IndianBulgarianBurmeseCajunCambodianCanadianCape VerdeanCarpatho RusynCelticCentral AmericanCentral American IndianCherokeeCheyenneChickasawChileanChineseChippewaChoctawColombianColvilleComancheCosta RicanCreeCreekCroatianCrowCubanCypriotCzechCzechoslovakianDanishDelawareDominicanDutchDutch West IndianEastern EuropeanEcuadorianEgyptianEnglishEstonianEthiopianEuropeanFijianFilipinoFinnishFrenchFrench American IndianFrench CanadianGermanGerman RussianGhanaianGreekGuamanian/ChamorroGuatemalanGuyaneseHaitianHmongHonduranHopiHoumaHungarianIcelanderIndian (Asian)IndonesianInupiatIranianIraqiIrishIroquoisIsraeliItalianJamaicanJapaneseJordanianKenyanKiowaKoreanLaotianLatvianLebaneseLiberianLithuanianLumbeeLuxembourgerMacedonianMalaysianMalteseMarshalleseMenomineeMexicanMexican American IndianMongolianMoroccanNative HawaiianNavajoNepaleseNew ZealanderNicaraguanNigerianNorthern EuropeanNorwegianOkinawanOsageOttawaPaiutePakistaniPalestinianPanamanianParaguayanPennsylvania GermanPeruvianPimaPolishPortuguesePotawatomiPuebloPuerto RicanPuget Sound SalishRomanianRussianSalvadoranSamoanScandinavianScotch-IrishScottishSeminoleSenegaleseSerbianShoshoneSierra LeoneanSiouxSlavicSlovakSomaliSouth AfricanSouth AmericanSouth American IndianSoviet UnionSpaniardSpanishSpanish AmericanSpanish American IndianSri LankanSubsaharan AfricanSudaneseSwedishSwissSyrianTaiwaneseThaiTlingit-HaidaTohono O'OdhamTonganTrinidadian and TobagonianTsimshianTurkishU.S. Virgin IslanderUgandanUkrainianUruguayanUteVenezuelanVietnameseWelshWest IndianYakamaYaquiYugoslavianYumanYup'ikZimbabwean
Immigration
NonimmigrantsImmigrantsAfghanistanAfricaAlbaniaArgentinaArmeniaAsiaAustraliaAustriaBahamasBangladeshBarbadosBelarusBelgiumBelizeBoliviaBosnia and HerzegovinaBrazilBulgariaBurma/MyanmarCabo VerdeCambodiaCameroonCanadaCaribbeanCentral AmericaChileChinaColombiaCongoCosta RicaCroatiaCubaCzechoslovakiaDenmarkDominicaDominican RepublicEastern AfricaEastern AsiaEastern EuropeEcuadorEgyptEl SalvadorEnglandEritreaEthiopiaEuropeFijiFranceGermanyGhanaGreeceGrenadaGuatemalaGuyanaHaitiHondurasHong KongHungaryIndiaIndonesiaIranIraqIrelandIsraelItalyJamaicaJapanJordanKazakhstanKenyaKoreaKuwaitLaosLatin AmericaLatviaLebanonLiberiaLithuaniaMalaysiaMexicoMicronesiaMiddle AfricaMoldovaMoroccoNepalNetherlandsNicaraguaNigeriaNorth AmericaNorth MacedoniaNorthern AfricaNorthern EuropeNorwayOceaniaPakistanPanamaPeruPhilippinesPolandPortugalRomaniaRussiaSaudi ArabiaScotlandSenegalSerbiaSierra LeoneSingaporeSomaliaSouth AfricaSouth AmericaSouth Central AsiaSouth Eastern AsiaSouthern EuropeSpainSri LankaSt. Vincent and the GrenadinesSudanSwedenSwitzerlandSyriaTaiwanThailandTrinidad and TobagoTurkeyUgandaUkraineUruguayUzbekistanVenezuelaVietnamWest IndiesWestern AfricaWestern AsiaWestern EuropeYemenZaireZimbabweAzores
Ambulatory Disability
Income
Poverty
Unemployment
Labor Participation
Family Structure
Vehicle Availability
Education Level
Disability

Ambulatory Disability Comparison

Slovenes

Immigrants from Kuwait

Poor
Exceptional
6.2%
AMBULATORY DISABILITY
18.0/ 100
METRIC RATING
205th/ 347
METRIC RANK
5.4%
AMBULATORY DISABILITY
100.0/ 100
METRIC RATING
21st/ 347
METRIC RANK

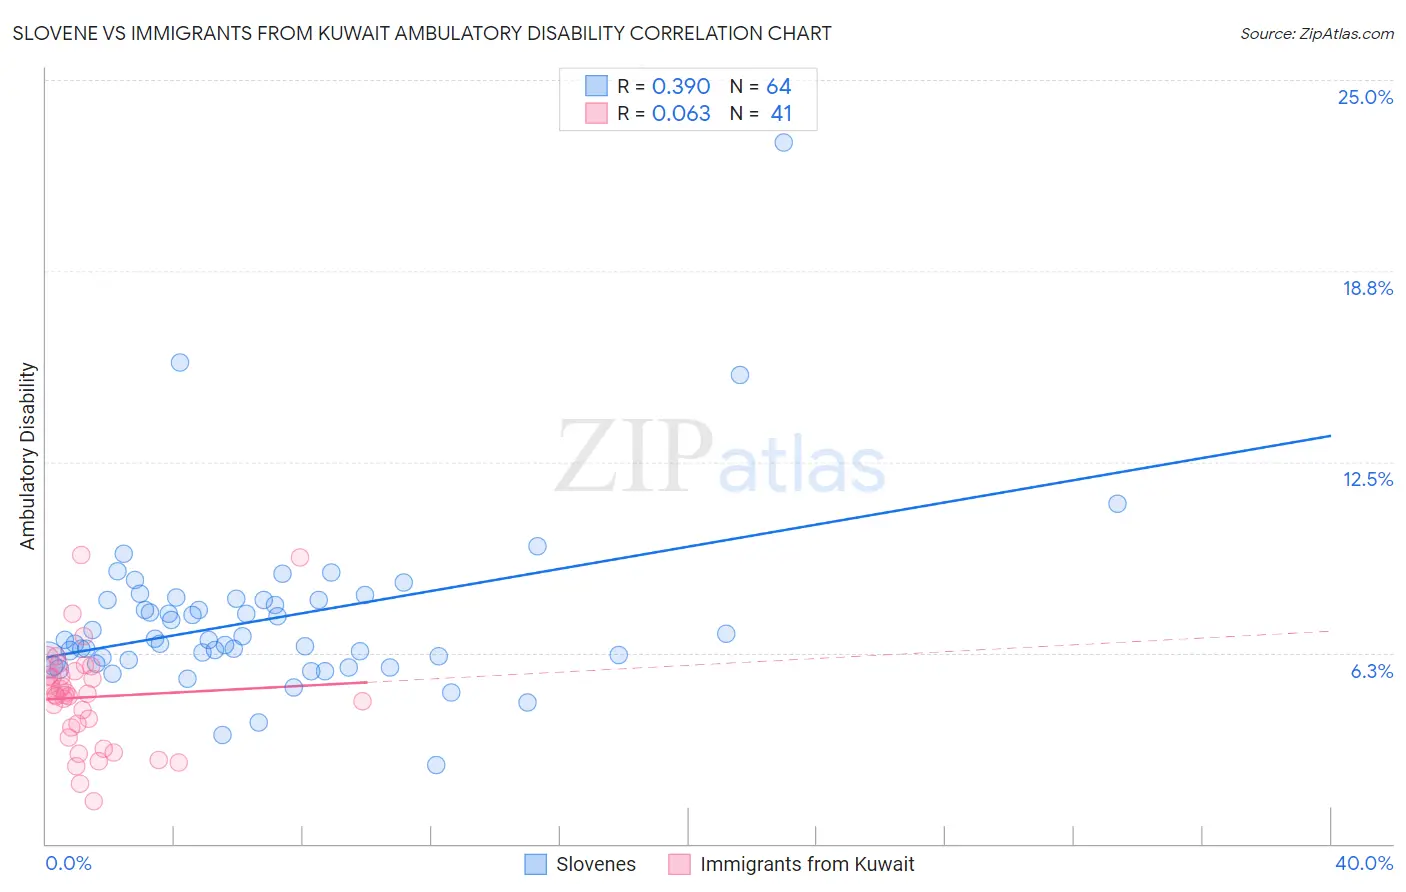
Slovene vs Immigrants from Kuwait Ambulatory Disability Correlation Chart

The statistical analysis conducted on geographies consisting of 261,334,117 people shows a mild positive correlation between the proportion of Slovenes and percentage of population with ambulatory disability in the United States with a correlation coefficient (R) of 0.390 and weighted average of 6.2%. Similarly, the statistical analysis conducted on geographies consisting of 136,900,049 people shows a slight positive correlation between the proportion of Immigrants from Kuwait and percentage of population with ambulatory disability in the United States with a correlation coefficient (R) of 0.063 and weighted average of 5.4%, a difference of 16.4%.
Slovene vs Immigrants from Kuwait Ambulatory Disability

Ambulatory Disability Correlation Summary

MeasurementSloveneImmigrants from Kuwait
Minimum2.6%1.4%
Maximum23.0%9.4%
Range20.4%8.1%
Mean7.3%4.8%
Median6.7%4.9%
Interquartile 25% (IQ1)6.0%3.6%
Interquartile 75% (IQ3)8.0%5.6%
Interquartile Range (IQR)2.0%1.9%
Standard Deviation (Sample)2.9%1.7%
Standard Deviation (Population)2.9%1.7%

Similar Demographics by Ambulatory Disability

Demographics Similar to Slovenes by Ambulatory Disability

In terms of ambulatory disability, the demographic groups most similar to Slovenes are Immigrants from Congo (6.2%, a difference of 0.020%), Immigrants from Ukraine (6.2%, a difference of 0.030%), Finnish (6.2%, a difference of 0.070%), Albanian (6.2%, a difference of 0.15%), and Immigrants from Central America (6.2%, a difference of 0.17%).
DemographicsRating | RankAmbulatory Disability
Immigrants | Bangladesh
24.6
/100
|
#198
Fair
6.2%
Italians
22.6
/100
|
#199
Fair
6.2%
Immigrants | Cambodia
21.5
/100
|
#200
Fair
6.2%
Immigrants | Central America
20.1
/100
|
#201
Fair
6.2%
Albanians
19.7
/100
|
#202
Poor
6.2%
Immigrants | Ukraine
18.4
/100
|
#203
Poor
6.2%
Immigrants | Congo
18.2
/100
|
#204
Poor
6.2%
Slovenes
18.0
/100
|
#205
Poor
6.2%
Finns
17.2
/100
|
#206
Poor
6.2%
Alsatians
15.1
/100
|
#207
Poor
6.3%
Bangladeshis
14.2
/100
|
#208
Poor
6.3%
Immigrants | Iraq
14.0
/100
|
#209
Poor
6.3%
Immigrants | Laos
13.2
/100
|
#210
Poor
6.3%
Samoans
12.1
/100
|
#211
Poor
6.3%
Mexican American Indians
12.0
/100
|
#212
Poor
6.3%

Demographics Similar to Immigrants from Kuwait by Ambulatory Disability

In terms of ambulatory disability, the demographic groups most similar to Immigrants from Kuwait are Ethiopian (5.4%, a difference of 0.0%), Indian (Asian) (5.4%, a difference of 0.020%), Immigrants from Ethiopia (5.4%, a difference of 0.13%), Immigrants from Sri Lanka (5.4%, a difference of 0.13%), and Immigrants from Israel (5.4%, a difference of 0.37%).
DemographicsRating | RankAmbulatory Disability
Immigrants | Eastern Asia
100.0
/100
|
#14
Exceptional
5.3%
Immigrants | China
100.0
/100
|
#15
Exceptional
5.3%
Immigrants | Hong Kong
100.0
/100
|
#16
Exceptional
5.3%
Immigrants | Ethiopia
100.0
/100
|
#17
Exceptional
5.4%
Immigrants | Sri Lanka
100.0
/100
|
#18
Exceptional
5.4%
Indians (Asian)
100.0
/100
|
#19
Exceptional
5.4%
Ethiopians
100.0
/100
|
#20
Exceptional
5.4%
Immigrants | Kuwait
100.0
/100
|
#21
Exceptional
5.4%
Immigrants | Israel
100.0
/100
|
#22
Exceptional
5.4%
Tongans
100.0
/100
|
#23
Exceptional
5.4%
Immigrants | Saudi Arabia
100.0
/100
|
#24
Exceptional
5.4%
Zimbabweans
100.0
/100
|
#25
Exceptional
5.4%
Immigrants | Nepal
100.0
/100
|
#26
Exceptional
5.4%
Asians
100.0
/100
|
#27
Exceptional
5.4%
Cambodians
100.0
/100
|
#28
Exceptional
5.4%