Pueblo vs Scandinavian Male Disability
COMPARE
Pueblo
Scandinavian
Male Disability
Male Disability Comparison
Pueblo
Scandinavians
15.0%
MALE DISABILITY
0.0/ 100
METRIC RATING
338th/ 347
METRIC RANK
12.3%
MALE DISABILITY
0.1/ 100
METRIC RATING
271st/ 347
METRIC RANK
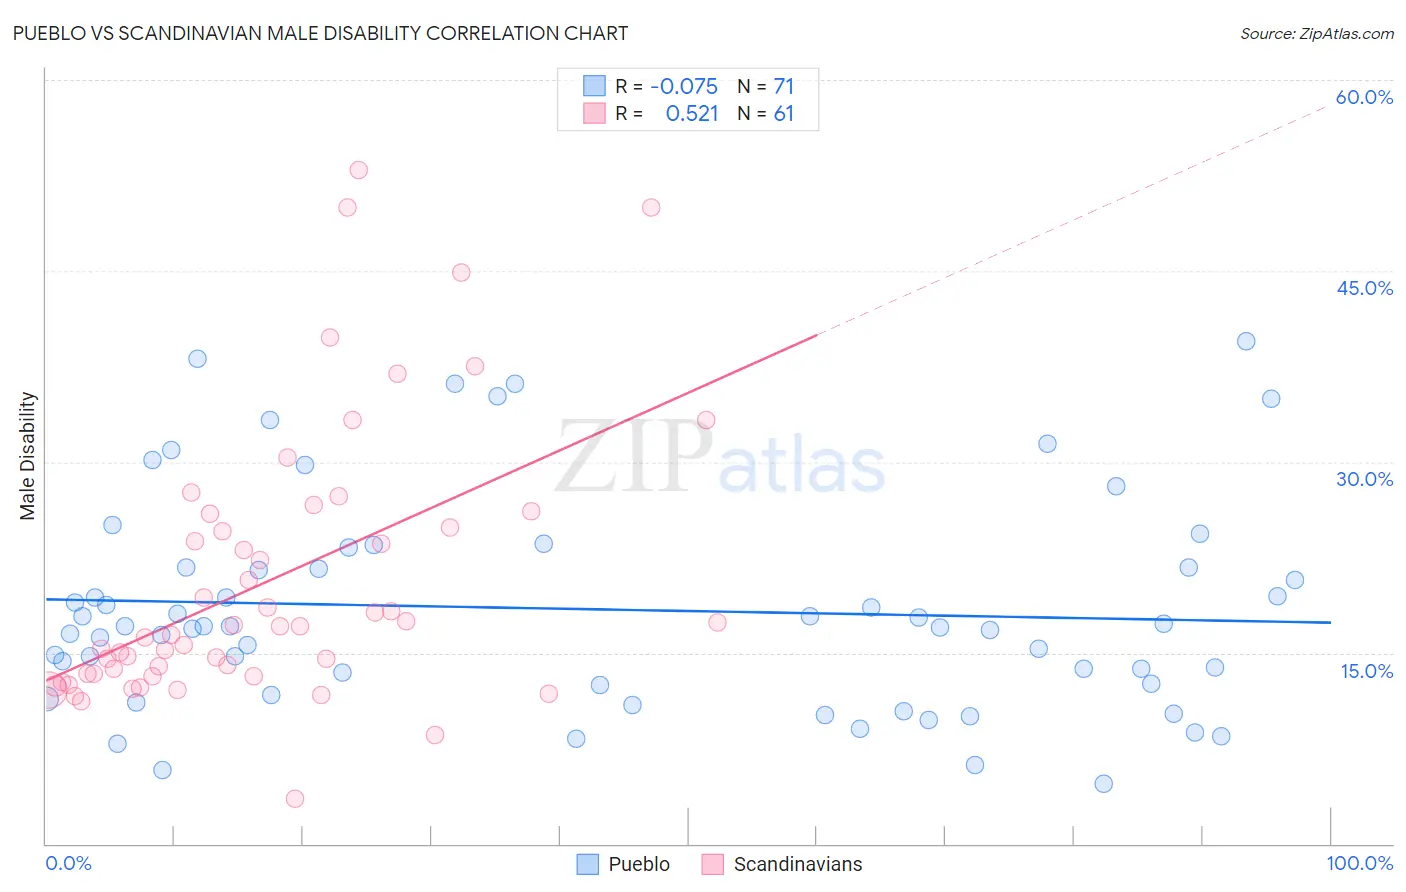
Pueblo vs Scandinavian Male Disability Correlation Chart
The statistical analysis conducted on geographies consisting of 120,077,979 people shows a slight negative correlation between the proportion of Pueblo and percentage of males with a disability in the United States with a correlation coefficient (R) of -0.075 and weighted average of 15.0%. Similarly, the statistical analysis conducted on geographies consisting of 472,512,703 people shows a substantial positive correlation between the proportion of Scandinavians and percentage of males with a disability in the United States with a correlation coefficient (R) of 0.521 and weighted average of 12.3%, a difference of 21.8%.
Male Disability Correlation Summary
| Measurement | Pueblo | Scandinavian |
| Minimum | 4.7% | 3.5% |
| Maximum | 39.5% | 52.9% |
| Range | 34.8% | 49.4% |
| Mean | 18.4% | 20.6% |
| Median | 17.1% | 17.0% |
| Interquartile 25% (IQ1) | 12.4% | 13.3% |
| Interquartile 75% (IQ3) | 21.7% | 25.4% |
| Interquartile Range (IQR) | 9.2% | 12.1% |
| Standard Deviation (Sample) | 8.4% | 10.7% |
| Standard Deviation (Population) | 8.3% | 10.7% |
Similar Demographics by Male Disability
Demographics Similar to Pueblo by Male Disability
In terms of male disability, the demographic groups most similar to Pueblo are Menominee (15.0%, a difference of 0.11%), Alaskan Athabascan (14.9%, a difference of 0.62%), Chickasaw (15.1%, a difference of 0.80%), Dutch West Indian (14.8%, a difference of 1.1%), and Cherokee (14.8%, a difference of 1.1%).
| Demographics | Rating | Rank | Male Disability |
| Tohono O'odham | 0.0 /100 | #331 | Tragic 14.6% |
| Seminole | 0.0 /100 | #332 | Tragic 14.7% |
| Yuman | 0.0 /100 | #333 | Tragic 14.7% |
| Cherokee | 0.0 /100 | #334 | Tragic 14.8% |
| Dutch West Indians | 0.0 /100 | #335 | Tragic 14.8% |
| Alaskan Athabascans | 0.0 /100 | #336 | Tragic 14.9% |
| Menominee | 0.0 /100 | #337 | Tragic 15.0% |
| Pueblo | 0.0 /100 | #338 | Tragic 15.0% |
| Chickasaw | 0.0 /100 | #339 | Tragic 15.1% |
| Lumbee | 0.0 /100 | #340 | Tragic 15.2% |
| Choctaw | 0.0 /100 | #341 | Tragic 15.4% |
| Kiowa | 0.0 /100 | #342 | Tragic 15.4% |
| Creek | 0.0 /100 | #343 | Tragic 15.5% |
| Puerto Ricans | 0.0 /100 | #344 | Tragic 15.6% |
| Tsimshian | 0.0 /100 | #345 | Tragic 15.6% |
Demographics Similar to Scandinavians by Male Disability
In terms of male disability, the demographic groups most similar to Scandinavians are Spaniard (12.3%, a difference of 0.19%), Portuguese (12.3%, a difference of 0.27%), Czechoslovakian (12.3%, a difference of 0.27%), Immigrants from Germany (12.3%, a difference of 0.40%), and Hawaiian (12.3%, a difference of 0.45%).
| Demographics | Rating | Rank | Male Disability |
| Nepalese | 0.2 /100 | #264 | Tragic 12.2% |
| Immigrants | Portugal | 0.1 /100 | #265 | Tragic 12.3% |
| Hawaiians | 0.1 /100 | #266 | Tragic 12.3% |
| Immigrants | Germany | 0.1 /100 | #267 | Tragic 12.3% |
| Portuguese | 0.1 /100 | #268 | Tragic 12.3% |
| Czechoslovakians | 0.1 /100 | #269 | Tragic 12.3% |
| Spaniards | 0.1 /100 | #270 | Tragic 12.3% |
| Scandinavians | 0.1 /100 | #271 | Tragic 12.3% |
| Hmong | 0.0 /100 | #272 | Tragic 12.5% |
| Native Hawaiians | 0.0 /100 | #273 | Tragic 12.5% |
| Hopi | 0.0 /100 | #274 | Tragic 12.5% |
| Fijians | 0.0 /100 | #275 | Tragic 12.6% |
| Africans | 0.0 /100 | #276 | Tragic 12.6% |
| Finns | 0.0 /100 | #277 | Tragic 12.6% |
| Central American Indians | 0.0 /100 | #278 | Tragic 12.7% |