Pennsylvania German vs Immigrants from Zimbabwe Disability Age 18 to 34
COMPARE
Pennsylvania German
Immigrants from Zimbabwe
Disability Age 18 to 34
Disability Age 18 to 34 Comparison
Pennsylvania Germans
Immigrants from Zimbabwe
7.8%
DISABILITY AGE 18 TO 34
0.0/ 100
METRIC RATING
308th/ 347
METRIC RANK
6.7%
DISABILITY AGE 18 TO 34
33.6/ 100
METRIC RATING
190th/ 347
METRIC RANK
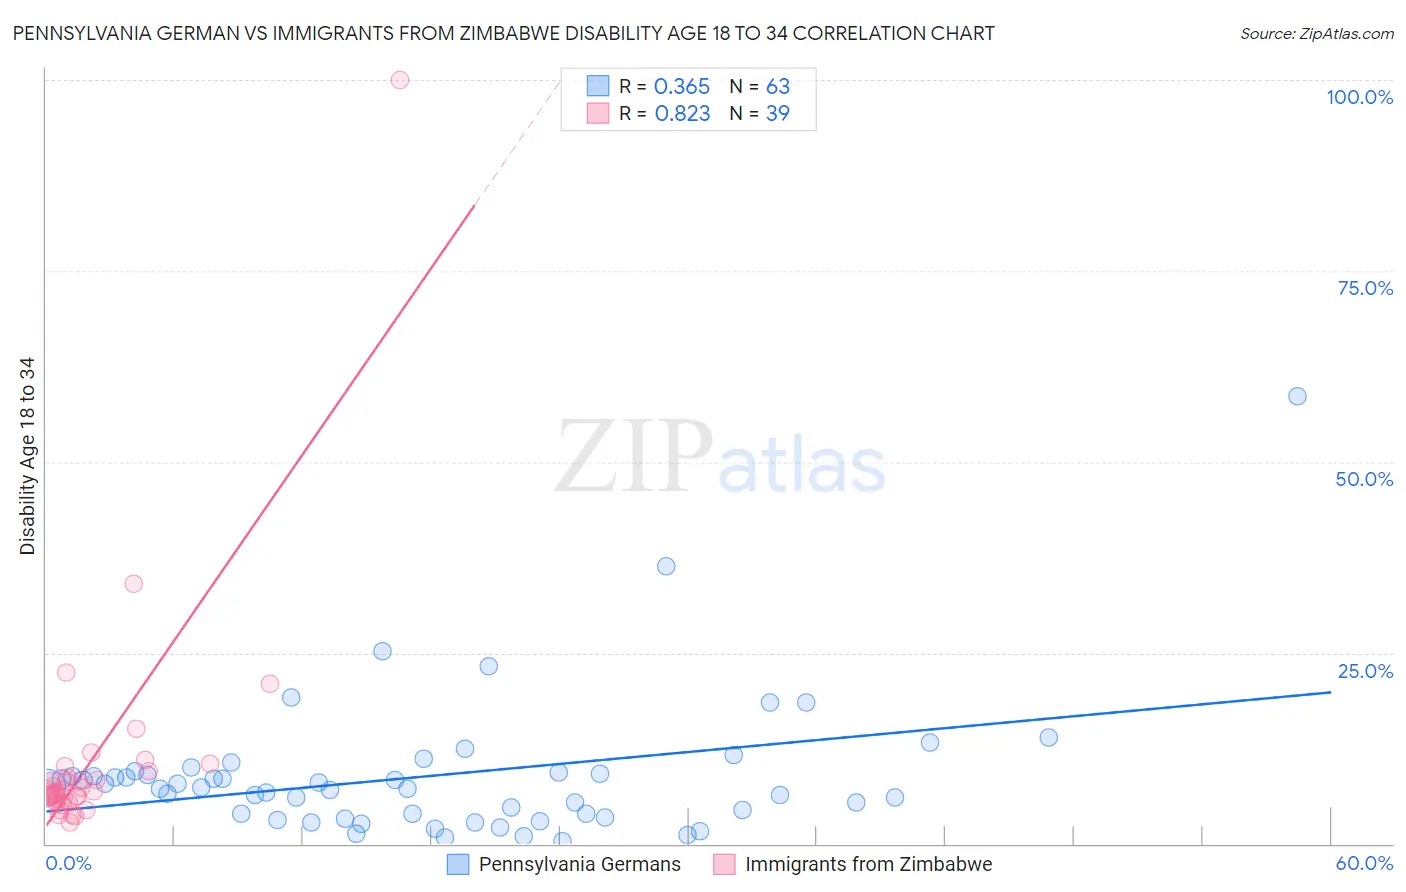
Pennsylvania German vs Immigrants from Zimbabwe Disability Age 18 to 34 Correlation Chart
The statistical analysis conducted on geographies consisting of 233,477,227 people shows a mild positive correlation between the proportion of Pennsylvania Germans and percentage of population with a disability between the ages 18 and 35 in the United States with a correlation coefficient (R) of 0.365 and weighted average of 7.8%. Similarly, the statistical analysis conducted on geographies consisting of 117,775,824 people shows a very strong positive correlation between the proportion of Immigrants from Zimbabwe and percentage of population with a disability between the ages 18 and 35 in the United States with a correlation coefficient (R) of 0.823 and weighted average of 6.7%, a difference of 16.9%.
Disability Age 18 to 34 Correlation Summary
| Measurement | Pennsylvania German | Immigrants from Zimbabwe |
| Minimum | 0.39% | 2.7% |
| Maximum | 58.7% | 100.0% |
| Range | 58.3% | 97.3% |
| Mean | 8.9% | 10.9% |
| Median | 7.3% | 6.7% |
| Interquartile 25% (IQ1) | 4.0% | 5.8% |
| Interquartile 75% (IQ3) | 9.3% | 9.6% |
| Interquartile Range (IQR) | 5.4% | 3.7% |
| Standard Deviation (Sample) | 9.0% | 15.8% |
| Standard Deviation (Population) | 8.9% | 15.6% |
Similar Demographics by Disability Age 18 to 34
Demographics Similar to Pennsylvania Germans by Disability Age 18 to 34
In terms of disability age 18 to 34, the demographic groups most similar to Pennsylvania Germans are Alaska Native (7.8%, a difference of 0.010%), Scotch-Irish (7.8%, a difference of 0.030%), Finnish (7.8%, a difference of 0.070%), English (7.8%, a difference of 0.28%), and Menominee (7.8%, a difference of 0.37%).
| Demographics | Rating | Rank | Disability Age 18 to 34 |
| Pima | 0.0 /100 | #301 | Tragic 7.7% |
| Welsh | 0.0 /100 | #302 | Tragic 7.7% |
| Cheyenne | 0.0 /100 | #303 | Tragic 7.7% |
| Shoshone | 0.0 /100 | #304 | Tragic 7.8% |
| Menominee | 0.0 /100 | #305 | Tragic 7.8% |
| English | 0.0 /100 | #306 | Tragic 7.8% |
| Scotch-Irish | 0.0 /100 | #307 | Tragic 7.8% |
| Pennsylvania Germans | 0.0 /100 | #308 | Tragic 7.8% |
| Alaska Natives | 0.0 /100 | #309 | Tragic 7.8% |
| Finns | 0.0 /100 | #310 | Tragic 7.8% |
| French | 0.0 /100 | #311 | Tragic 7.9% |
| Spanish Americans | 0.0 /100 | #312 | Tragic 7.9% |
| Iroquois | 0.0 /100 | #313 | Tragic 7.9% |
| Colville | 0.0 /100 | #314 | Tragic 7.9% |
| Americans | 0.0 /100 | #315 | Tragic 8.0% |
Demographics Similar to Immigrants from Zimbabwe by Disability Age 18 to 34
In terms of disability age 18 to 34, the demographic groups most similar to Immigrants from Zimbabwe are Pakistani (6.7%, a difference of 0.010%), Immigrants from Eastern Africa (6.7%, a difference of 0.030%), Immigrants from Cameroon (6.7%, a difference of 0.070%), Maltese (6.7%, a difference of 0.090%), and Immigrants from Oceania (6.7%, a difference of 0.13%).
| Demographics | Rating | Rank | Disability Age 18 to 34 |
| Immigrants | Iraq | 37.4 /100 | #183 | Fair 6.7% |
| Iraqis | 37.4 /100 | #184 | Fair 6.7% |
| Immigrants | Oceania | 35.4 /100 | #185 | Fair 6.7% |
| Yup'ik | 35.3 /100 | #186 | Fair 6.7% |
| Maltese | 34.8 /100 | #187 | Fair 6.7% |
| Immigrants | Cameroon | 34.5 /100 | #188 | Fair 6.7% |
| Pakistanis | 33.7 /100 | #189 | Fair 6.7% |
| Immigrants | Zimbabwe | 33.6 /100 | #190 | Fair 6.7% |
| Immigrants | Eastern Africa | 33.2 /100 | #191 | Fair 6.7% |
| Immigrants | Western Africa | 28.3 /100 | #192 | Fair 6.7% |
| Immigrants | Uganda | 25.1 /100 | #193 | Fair 6.7% |
| Immigrants | Sudan | 24.9 /100 | #194 | Fair 6.7% |
| Mexican American Indians | 22.3 /100 | #195 | Fair 6.7% |
| Immigrants | Netherlands | 21.0 /100 | #196 | Fair 6.7% |
| Estonians | 20.6 /100 | #197 | Fair 6.8% |