Paraguayan vs Immigrants from Laos Ambulatory Disability
COMPARE
Paraguayan
Immigrants from Laos
Ambulatory Disability
Ambulatory Disability Comparison
Paraguayans
Immigrants from Laos
5.5%
AMBULATORY DISABILITY
99.9/ 100
METRIC RATING
43rd/ 347
METRIC RANK
6.3%
AMBULATORY DISABILITY
13.2/ 100
METRIC RATING
210th/ 347
METRIC RANK
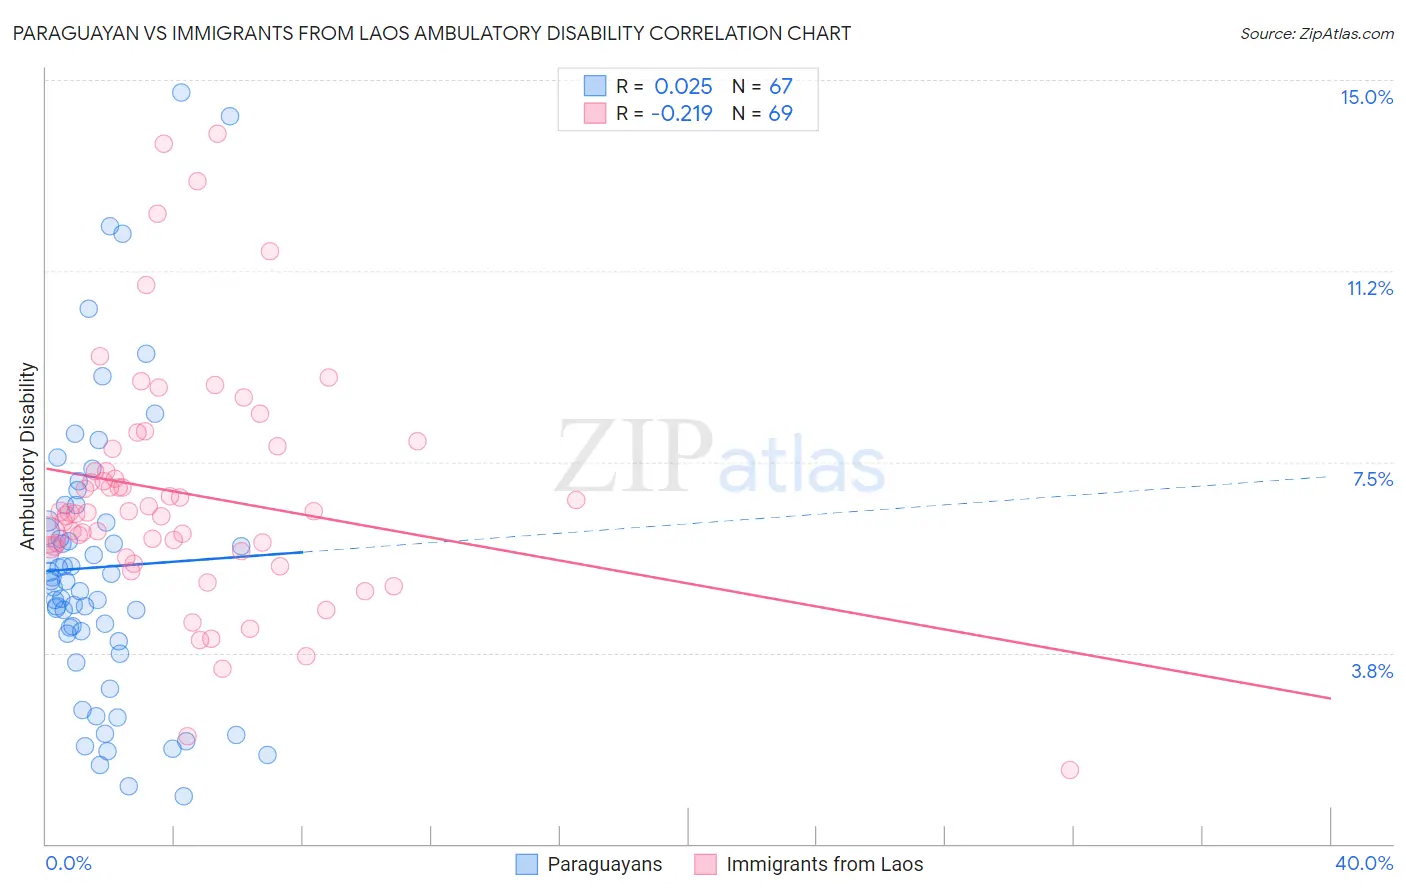
Paraguayan vs Immigrants from Laos Ambulatory Disability Correlation Chart
The statistical analysis conducted on geographies consisting of 95,109,897 people shows no correlation between the proportion of Paraguayans and percentage of population with ambulatory disability in the United States with a correlation coefficient (R) of 0.025 and weighted average of 5.5%. Similarly, the statistical analysis conducted on geographies consisting of 201,465,206 people shows a weak negative correlation between the proportion of Immigrants from Laos and percentage of population with ambulatory disability in the United States with a correlation coefficient (R) of -0.219 and weighted average of 6.3%, a difference of 13.2%.
Ambulatory Disability Correlation Summary
| Measurement | Paraguayan | Immigrants from Laos |
| Minimum | 0.94% | 1.4% |
| Maximum | 14.7% | 13.9% |
| Range | 13.8% | 12.5% |
| Mean | 5.4% | 6.9% |
| Median | 5.2% | 6.5% |
| Interquartile 25% (IQ1) | 4.0% | 5.8% |
| Interquartile 75% (IQ3) | 6.3% | 7.8% |
| Interquartile Range (IQR) | 2.4% | 2.0% |
| Standard Deviation (Sample) | 2.9% | 2.4% |
| Standard Deviation (Population) | 2.8% | 2.4% |
Similar Demographics by Ambulatory Disability
Demographics Similar to Paraguayans by Ambulatory Disability
In terms of ambulatory disability, the demographic groups most similar to Paraguayans are Immigrants from Indonesia (5.5%, a difference of 0.12%), Immigrants from Sweden (5.6%, a difference of 0.28%), Egyptian (5.6%, a difference of 0.29%), Immigrants from Japan (5.6%, a difference of 0.30%), and Immigrants from Argentina (5.6%, a difference of 0.31%).
| Demographics | Rating | Rank | Ambulatory Disability |
| Immigrants | Malaysia | 100.0 /100 | #36 | Exceptional 5.5% |
| Turks | 100.0 /100 | #37 | Exceptional 5.5% |
| Cypriots | 100.0 /100 | #38 | Exceptional 5.5% |
| Immigrants | Eritrea | 100.0 /100 | #39 | Exceptional 5.5% |
| Venezuelans | 99.9 /100 | #40 | Exceptional 5.5% |
| Mongolians | 99.9 /100 | #41 | Exceptional 5.5% |
| Argentineans | 99.9 /100 | #42 | Exceptional 5.5% |
| Paraguayans | 99.9 /100 | #43 | Exceptional 5.5% |
| Immigrants | Indonesia | 99.9 /100 | #44 | Exceptional 5.5% |
| Immigrants | Sweden | 99.9 /100 | #45 | Exceptional 5.6% |
| Egyptians | 99.9 /100 | #46 | Exceptional 5.6% |
| Immigrants | Japan | 99.9 /100 | #47 | Exceptional 5.6% |
| Immigrants | Argentina | 99.9 /100 | #48 | Exceptional 5.6% |
| Bulgarians | 99.9 /100 | #49 | Exceptional 5.6% |
| Luxembourgers | 99.9 /100 | #50 | Exceptional 5.6% |
Demographics Similar to Immigrants from Laos by Ambulatory Disability
In terms of ambulatory disability, the demographic groups most similar to Immigrants from Laos are Immigrants from Iraq (6.3%, a difference of 0.080%), Bangladeshi (6.3%, a difference of 0.10%), Samoan (6.3%, a difference of 0.14%), Mexican American Indian (6.3%, a difference of 0.15%), and Japanese (6.3%, a difference of 0.15%).
| Demographics | Rating | Rank | Ambulatory Disability |
| Immigrants | Ukraine | 18.4 /100 | #203 | Poor 6.2% |
| Immigrants | Congo | 18.2 /100 | #204 | Poor 6.2% |
| Slovenes | 18.0 /100 | #205 | Poor 6.2% |
| Finns | 17.2 /100 | #206 | Poor 6.2% |
| Alsatians | 15.1 /100 | #207 | Poor 6.3% |
| Bangladeshis | 14.2 /100 | #208 | Poor 6.3% |
| Immigrants | Iraq | 14.0 /100 | #209 | Poor 6.3% |
| Immigrants | Laos | 13.2 /100 | #210 | Poor 6.3% |
| Samoans | 12.1 /100 | #211 | Poor 6.3% |
| Mexican American Indians | 12.0 /100 | #212 | Poor 6.3% |
| Japanese | 12.0 /100 | #213 | Poor 6.3% |
| Immigrants | Mexico | 11.0 /100 | #214 | Poor 6.3% |
| Immigrants | Latin America | 11.0 /100 | #215 | Poor 6.3% |
| Canadians | 10.9 /100 | #216 | Poor 6.3% |
| Yugoslavians | 10.9 /100 | #217 | Poor 6.3% |