Panamanian vs Immigrants from Belize Disability Age 65 to 74
COMPARE
Panamanian
Immigrants from Belize
Disability Age 65 to 74
Disability Age 65 to 74 Comparison
Panamanians
Immigrants from Belize
24.4%
DISABILITY AGE 65 TO 74
4.2/ 100
METRIC RATING
234th/ 347
METRIC RANK
25.8%
DISABILITY AGE 65 TO 74
0.1/ 100
METRIC RATING
278th/ 347
METRIC RANK
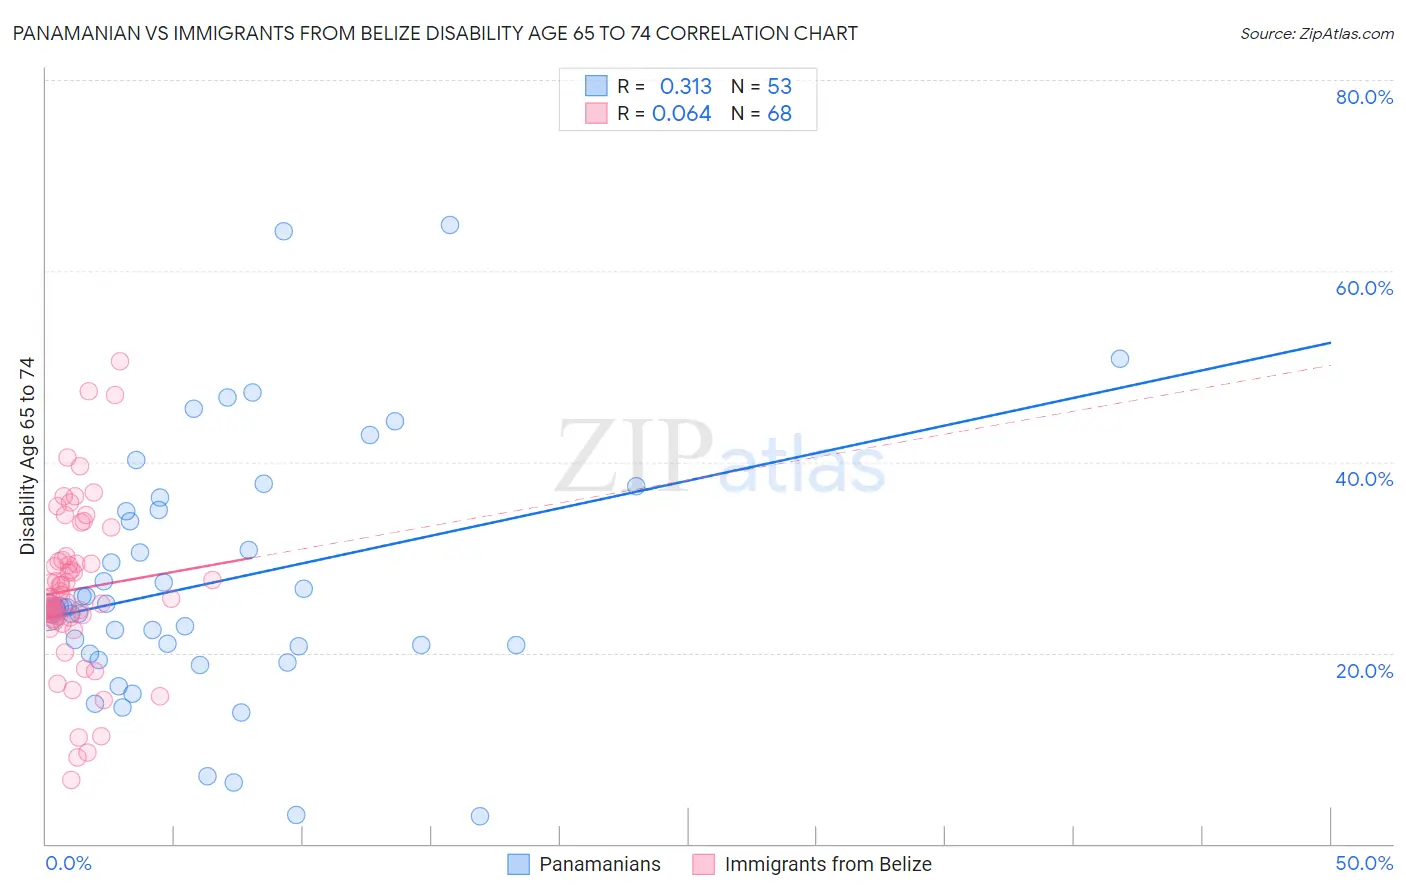
Panamanian vs Immigrants from Belize Disability Age 65 to 74 Correlation Chart
The statistical analysis conducted on geographies consisting of 280,720,720 people shows a mild positive correlation between the proportion of Panamanians and percentage of population with a disability between the ages 65 and 75 in the United States with a correlation coefficient (R) of 0.313 and weighted average of 24.4%. Similarly, the statistical analysis conducted on geographies consisting of 130,230,175 people shows a slight positive correlation between the proportion of Immigrants from Belize and percentage of population with a disability between the ages 65 and 75 in the United States with a correlation coefficient (R) of 0.064 and weighted average of 25.8%, a difference of 5.9%.
Disability Age 65 to 74 Correlation Summary
| Measurement | Panamanian | Immigrants from Belize |
| Minimum | 2.9% | 6.7% |
| Maximum | 64.9% | 50.6% |
| Range | 62.0% | 43.9% |
| Mean | 27.4% | 26.6% |
| Median | 24.7% | 25.8% |
| Interquartile 25% (IQ1) | 20.3% | 23.6% |
| Interquartile 75% (IQ3) | 34.9% | 29.7% |
| Interquartile Range (IQR) | 14.6% | 6.1% |
| Standard Deviation (Sample) | 13.2% | 8.5% |
| Standard Deviation (Population) | 13.0% | 8.4% |
Similar Demographics by Disability Age 65 to 74
Demographics Similar to Panamanians by Disability Age 65 to 74
In terms of disability age 65 to 74, the demographic groups most similar to Panamanians are Bahamian (24.4%, a difference of 0.11%), Scotch-Irish (24.4%, a difference of 0.16%), German Russian (24.4%, a difference of 0.19%), Immigrants from Zaire (24.3%, a difference of 0.27%), and West Indian (24.5%, a difference of 0.29%).
| Demographics | Rating | Rank | Disability Age 65 to 74 |
| Nigerians | 7.8 /100 | #227 | Tragic 24.2% |
| Whites/Caucasians | 6.6 /100 | #228 | Tragic 24.2% |
| Celtics | 6.4 /100 | #229 | Tragic 24.2% |
| Barbadians | 6.0 /100 | #230 | Tragic 24.3% |
| Immigrants | Thailand | 5.2 /100 | #231 | Tragic 24.3% |
| Immigrants | Zaire | 5.0 /100 | #232 | Tragic 24.3% |
| Bahamians | 4.5 /100 | #233 | Tragic 24.4% |
| Panamanians | 4.2 /100 | #234 | Tragic 24.4% |
| Scotch-Irish | 3.8 /100 | #235 | Tragic 24.4% |
| German Russians | 3.7 /100 | #236 | Tragic 24.4% |
| West Indians | 3.4 /100 | #237 | Tragic 24.5% |
| Immigrants | Ghana | 3.0 /100 | #238 | Tragic 24.5% |
| Immigrants | Caribbean | 2.6 /100 | #239 | Tragic 24.6% |
| Spaniards | 2.4 /100 | #240 | Tragic 24.6% |
| Immigrants | Western Africa | 2.3 /100 | #241 | Tragic 24.6% |
Demographics Similar to Immigrants from Belize by Disability Age 65 to 74
In terms of disability age 65 to 74, the demographic groups most similar to Immigrants from Belize are Belizean (25.8%, a difference of 0.020%), U.S. Virgin Islander (25.9%, a difference of 0.080%), French American Indian (25.8%, a difference of 0.11%), American (25.8%, a difference of 0.13%), and Honduran (25.8%, a difference of 0.13%).
| Demographics | Rating | Rank | Disability Age 65 to 74 |
| Immigrants | Liberia | 0.1 /100 | #271 | Tragic 25.7% |
| Immigrants | Dominica | 0.1 /100 | #272 | Tragic 25.7% |
| Japanese | 0.1 /100 | #273 | Tragic 25.7% |
| Americans | 0.1 /100 | #274 | Tragic 25.8% |
| Hondurans | 0.1 /100 | #275 | Tragic 25.8% |
| French American Indians | 0.1 /100 | #276 | Tragic 25.8% |
| Belizeans | 0.1 /100 | #277 | Tragic 25.8% |
| Immigrants | Belize | 0.1 /100 | #278 | Tragic 25.8% |
| U.S. Virgin Islanders | 0.1 /100 | #279 | Tragic 25.9% |
| Cree | 0.1 /100 | #280 | Tragic 25.9% |
| Immigrants | Honduras | 0.1 /100 | #281 | Tragic 25.9% |
| Delaware | 0.1 /100 | #282 | Tragic 25.9% |
| Spanish Americans | 0.0 /100 | #283 | Tragic 25.9% |
| Immigrants | Azores | 0.0 /100 | #284 | Tragic 26.0% |
| Immigrants | Congo | 0.0 /100 | #285 | Tragic 26.0% |