Immigrants from Greece vs Immigrants from Belize Disability Age 65 to 74

COMPARE

Immigrants from Greece
Race
Ancestry
AfghanAfricanAlaska NativeAlaskan AthabascanAlbanianAleutAlsatianAmericanApacheArabArapahoArgentineanArmenianAssyrian/Chaldean/SyriacAustralianAustrianBahamianBangladeshiBarbadianBasqueBelgianBelizeanBermudanBhutaneseBlackfeetBolivianBrazilianBritishBritish West IndianBulgarianBurmeseCajunCambodianCanadianCape VerdeanCarpatho RusynCelticCentral AmericanCentral American IndianCherokeeCheyenneChickasawChileanChineseChippewaChoctawColombianColvilleComancheCosta RicanCreeCreekCroatianCrowCubanCypriotCzechCzechoslovakianDanishDelawareDominicanDutchDutch West IndianEastern EuropeanEcuadorianEgyptianEnglishEstonianEthiopianEuropeanFijianFilipinoFinnishFrenchFrench American IndianFrench CanadianGermanGerman RussianGhanaianGreekGuamanian/ChamorroGuatemalanGuyaneseHaitianHmongHonduranHopiHoumaHungarianIcelanderIndian (Asian)IndonesianInupiatIranianIraqiIrishIroquoisIsraeliItalianJamaicanJapaneseJordanianKenyanKiowaKoreanLaotianLatvianLebaneseLiberianLithuanianLumbeeLuxembourgerMacedonianMalaysianMalteseMarshalleseMenomineeMexicanMexican American IndianMongolianMoroccanNative HawaiianNavajoNepaleseNew ZealanderNicaraguanNigerianNorthern EuropeanNorwegianOkinawanOsageOttawaPaiutePakistaniPalestinianPanamanianParaguayanPennsylvania GermanPeruvianPimaPolishPortuguesePotawatomiPuebloPuerto RicanPuget Sound SalishRomanianRussianSalvadoranSamoanScandinavianScotch-IrishScottishSeminoleSenegaleseSerbianShoshoneSierra LeoneanSiouxSlavicSlovakSloveneSomaliSouth AfricanSouth AmericanSouth American IndianSoviet UnionSpaniardSpanishSpanish AmericanSpanish American IndianSri LankanSubsaharan AfricanSudaneseSwedishSwissSyrianTaiwaneseThaiTlingit-HaidaTohono O'OdhamTonganTrinidadian and TobagonianTsimshianTurkishU.S. Virgin IslanderUgandanUkrainianUruguayanUteVenezuelanVietnameseWelshWest IndianYakamaYaquiYugoslavianYumanYup'ikZimbabwean
Immigration
NonimmigrantsImmigrantsAfghanistanAfricaAlbaniaArgentinaArmeniaAsiaAustraliaAustriaBahamasBangladeshBarbadosBelarusBelgiumBoliviaBosnia and HerzegovinaBrazilBulgariaBurma/MyanmarCabo VerdeCambodiaCameroonCanadaCaribbeanCentral AmericaChileChinaColombiaCongoCosta RicaCroatiaCubaCzechoslovakiaDenmarkDominicaDominican RepublicEastern AfricaEastern AsiaEastern EuropeEcuadorEgyptEl SalvadorEnglandEritreaEthiopiaEuropeFijiFranceGermanyGhanaGreeceGrenadaGuatemalaGuyanaHaitiHondurasHong KongHungaryIndiaIndonesiaIranIraqIrelandIsraelItalyJamaicaJapanJordanKazakhstanKenyaKoreaKuwaitLaosLatin AmericaLatviaLebanonLiberiaLithuaniaMalaysiaMexicoMicronesiaMiddle AfricaMoldovaMoroccoNepalNetherlandsNicaraguaNigeriaNorth AmericaNorth MacedoniaNorthern AfricaNorthern EuropeNorwayOceaniaPakistanPanamaPeruPhilippinesPolandPortugalRomaniaRussiaSaudi ArabiaScotlandSenegalSerbiaSierra LeoneSingaporeSomaliaSouth AfricaSouth AmericaSouth Central AsiaSouth Eastern AsiaSouthern EuropeSpainSri LankaSt. Vincent and the GrenadinesSudanSwedenSwitzerlandSyriaTaiwanThailandTrinidad and TobagoTurkeyUgandaUkraineUruguayUzbekistanVenezuelaVietnamWest IndiesWestern AfricaWestern AsiaWestern EuropeYemenZaireZimbabweAzores
Immigrants from Belize
Race
Ancestry
AfghanAfricanAlaska NativeAlaskan AthabascanAlbanianAleutAlsatianAmericanApacheArabArapahoArgentineanArmenianAssyrian/Chaldean/SyriacAustralianAustrianBahamianBangladeshiBarbadianBasqueBelgianBelizeanBermudanBhutaneseBlackfeetBolivianBrazilianBritishBritish West IndianBulgarianBurmeseCajunCambodianCanadianCape VerdeanCarpatho RusynCelticCentral AmericanCentral American IndianCherokeeCheyenneChickasawChileanChineseChippewaChoctawColombianColvilleComancheCosta RicanCreeCreekCroatianCrowCubanCypriotCzechCzechoslovakianDanishDelawareDominicanDutchDutch West IndianEastern EuropeanEcuadorianEgyptianEnglishEstonianEthiopianEuropeanFijianFilipinoFinnishFrenchFrench American IndianFrench CanadianGermanGerman RussianGhanaianGreekGuamanian/ChamorroGuatemalanGuyaneseHaitianHmongHonduranHopiHoumaHungarianIcelanderIndian (Asian)IndonesianInupiatIranianIraqiIrishIroquoisIsraeliItalianJamaicanJapaneseJordanianKenyanKiowaKoreanLaotianLatvianLebaneseLiberianLithuanianLumbeeLuxembourgerMacedonianMalaysianMalteseMarshalleseMenomineeMexicanMexican American IndianMongolianMoroccanNative HawaiianNavajoNepaleseNew ZealanderNicaraguanNigerianNorthern EuropeanNorwegianOkinawanOsageOttawaPaiutePakistaniPalestinianPanamanianParaguayanPennsylvania GermanPeruvianPimaPolishPortuguesePotawatomiPuebloPuerto RicanPuget Sound SalishRomanianRussianSalvadoranSamoanScandinavianScotch-IrishScottishSeminoleSenegaleseSerbianShoshoneSierra LeoneanSiouxSlavicSlovakSloveneSomaliSouth AfricanSouth AmericanSouth American IndianSoviet UnionSpaniardSpanishSpanish AmericanSpanish American IndianSri LankanSubsaharan AfricanSudaneseSwedishSwissSyrianTaiwaneseThaiTlingit-HaidaTohono O'OdhamTonganTrinidadian and TobagonianTsimshianTurkishU.S. Virgin IslanderUgandanUkrainianUruguayanUteVenezuelanVietnameseWelshWest IndianYakamaYaquiYugoslavianYumanYup'ikZimbabwean
Immigration
NonimmigrantsImmigrantsAfghanistanAfricaAlbaniaArgentinaArmeniaAsiaAustraliaAustriaBahamasBangladeshBarbadosBelarusBelgiumBelizeBoliviaBosnia and HerzegovinaBrazilBulgariaBurma/MyanmarCabo VerdeCambodiaCameroonCanadaCaribbeanCentral AmericaChileChinaColombiaCongoCosta RicaCroatiaCubaCzechoslovakiaDenmarkDominicaDominican RepublicEastern AfricaEastern AsiaEastern EuropeEcuadorEgyptEl SalvadorEnglandEritreaEthiopiaEuropeFijiFranceGermanyGhanaGrenadaGuatemalaGuyanaHaitiHondurasHong KongHungaryIndiaIndonesiaIranIraqIrelandIsraelItalyJamaicaJapanJordanKazakhstanKenyaKoreaKuwaitLaosLatin AmericaLatviaLebanonLiberiaLithuaniaMalaysiaMexicoMicronesiaMiddle AfricaMoldovaMoroccoNepalNetherlandsNicaraguaNigeriaNorth AmericaNorth MacedoniaNorthern AfricaNorthern EuropeNorwayOceaniaPakistanPanamaPeruPhilippinesPolandPortugalRomaniaRussiaSaudi ArabiaScotlandSenegalSerbiaSierra LeoneSingaporeSomaliaSouth AfricaSouth AmericaSouth Central AsiaSouth Eastern AsiaSouthern EuropeSpainSri LankaSt. Vincent and the GrenadinesSudanSwedenSwitzerlandSyriaTaiwanThailandTrinidad and TobagoTurkeyUgandaUkraineUruguayUzbekistanVenezuelaVietnamWest IndiesWestern AfricaWestern AsiaWestern EuropeYemenZaireZimbabweAzores
Disability Age 65 to 74
Income
Poverty
Unemployment
Labor Participation
Family Structure
Vehicle Availability
Education Level
Disability

Disability Age 65 to 74 Comparison

Immigrants from Greece

Immigrants from Belize

Exceptional
Tragic
21.0%
DISABILITY AGE 65 TO 74
99.9/ 100
METRIC RATING
30th/ 347
METRIC RANK
25.8%
DISABILITY AGE 65 TO 74
0.1/ 100
METRIC RATING
278th/ 347
METRIC RANK

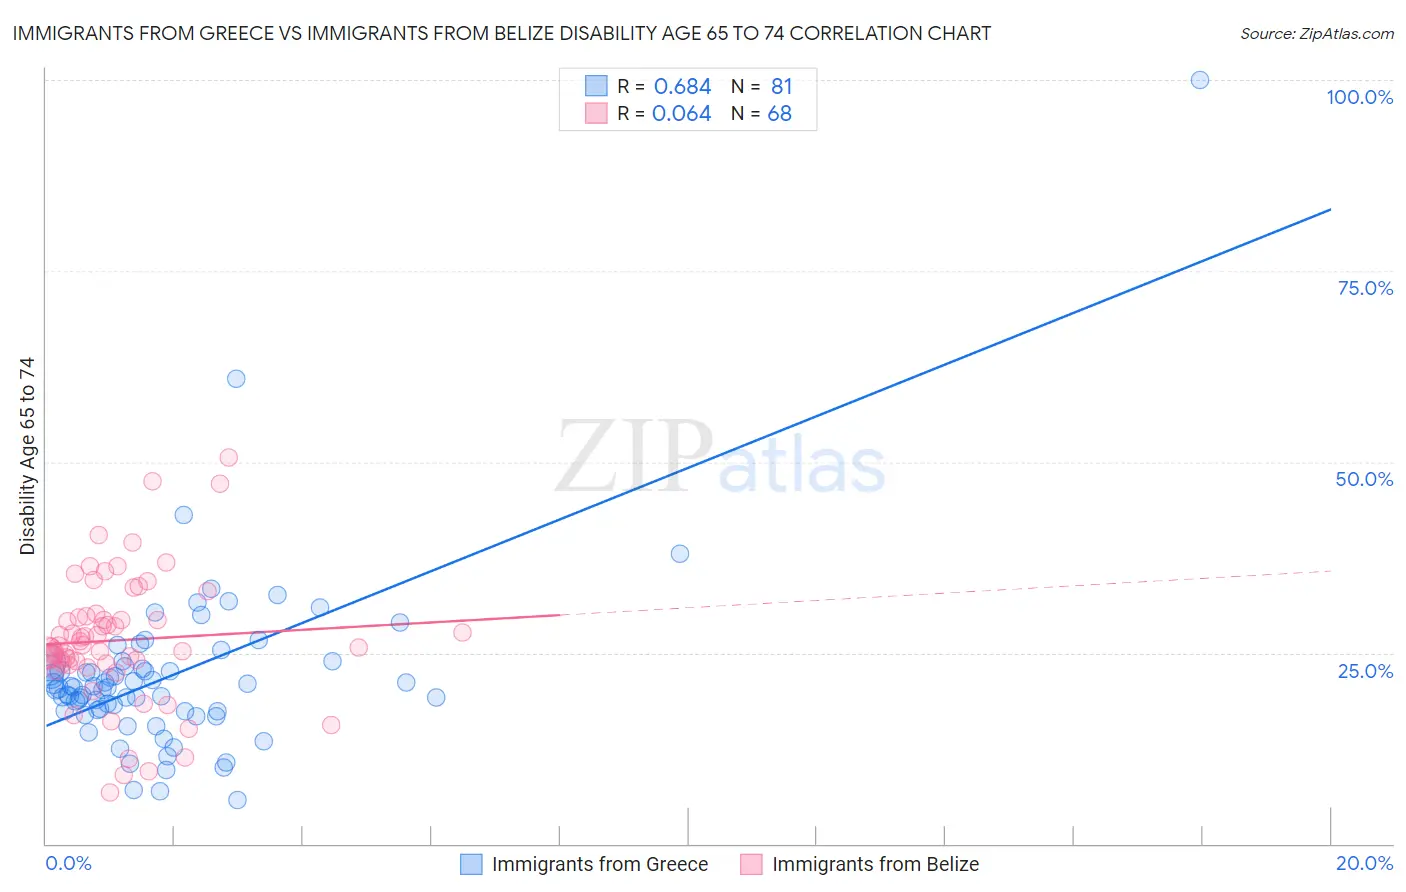
Immigrants from Greece vs Immigrants from Belize Disability Age 65 to 74 Correlation Chart

The statistical analysis conducted on geographies consisting of 216,768,071 people shows a significant positive correlation between the proportion of Immigrants from Greece and percentage of population with a disability between the ages 65 and 75 in the United States with a correlation coefficient (R) of 0.684 and weighted average of 21.0%. Similarly, the statistical analysis conducted on geographies consisting of 130,230,175 people shows a slight positive correlation between the proportion of Immigrants from Belize and percentage of population with a disability between the ages 65 and 75 in the United States with a correlation coefficient (R) of 0.064 and weighted average of 25.8%, a difference of 23.0%.
Immigrants from Greece vs Immigrants from Belize Disability Age 65 to 74

Disability Age 65 to 74 Correlation Summary

MeasurementImmigrants from GreeceImmigrants from Belize
Minimum5.8%6.7%
Maximum100.0%50.6%
Range94.2%43.9%
Mean22.0%26.6%
Median20.5%25.8%
Interquartile 25% (IQ1)17.4%23.6%
Interquartile 75% (IQ3)23.4%29.7%
Interquartile Range (IQR)6.0%6.1%
Standard Deviation (Sample)11.9%8.5%
Standard Deviation (Population)11.8%8.4%

Similar Demographics by Disability Age 65 to 74

Demographics Similar to Immigrants from Greece by Disability Age 65 to 74

In terms of disability age 65 to 74, the demographic groups most similar to Immigrants from Greece are Immigrants from Japan (21.0%, a difference of 0.040%), Immigrants from Northern Europe (21.0%, a difference of 0.040%), Turkish (21.0%, a difference of 0.070%), Immigrants from Czechoslovakia (21.0%, a difference of 0.080%), and Immigrants from Sweden (21.0%, a difference of 0.18%).
DemographicsRating | RankDisability Age 65 to 74
Immigrants | Belgium
99.9
/100
|
#23
Exceptional
21.0%
Soviet Union
99.9
/100
|
#24
Exceptional
21.0%
Bolivians
99.9
/100
|
#25
Exceptional
21.0%
Immigrants | Australia
99.9
/100
|
#26
Exceptional
21.0%
Immigrants | Sweden
99.9
/100
|
#27
Exceptional
21.0%
Immigrants | Czechoslovakia
99.9
/100
|
#28
Exceptional
21.0%
Immigrants | Japan
99.9
/100
|
#29
Exceptional
21.0%
Immigrants | Greece
99.9
/100
|
#30
Exceptional
21.0%
Immigrants | Northern Europe
99.9
/100
|
#31
Exceptional
21.0%
Turks
99.9
/100
|
#32
Exceptional
21.0%
Immigrants | Argentina
99.9
/100
|
#33
Exceptional
21.1%
Immigrants | Sri Lanka
99.9
/100
|
#34
Exceptional
21.1%
Bulgarians
99.9
/100
|
#35
Exceptional
21.1%
Immigrants | Switzerland
99.8
/100
|
#36
Exceptional
21.1%
Israelis
99.8
/100
|
#37
Exceptional
21.2%

Demographics Similar to Immigrants from Belize by Disability Age 65 to 74

In terms of disability age 65 to 74, the demographic groups most similar to Immigrants from Belize are Belizean (25.8%, a difference of 0.020%), U.S. Virgin Islander (25.9%, a difference of 0.080%), French American Indian (25.8%, a difference of 0.11%), American (25.8%, a difference of 0.13%), and Honduran (25.8%, a difference of 0.13%).
DemographicsRating | RankDisability Age 65 to 74
Immigrants | Liberia
0.1
/100
|
#271
Tragic
25.7%
Immigrants | Dominica
0.1
/100
|
#272
Tragic
25.7%
Japanese
0.1
/100
|
#273
Tragic
25.7%
Americans
0.1
/100
|
#274
Tragic
25.8%
Hondurans
0.1
/100
|
#275
Tragic
25.8%
French American Indians
0.1
/100
|
#276
Tragic
25.8%
Belizeans
0.1
/100
|
#277
Tragic
25.8%
Immigrants | Belize
0.1
/100
|
#278
Tragic
25.8%
U.S. Virgin Islanders
0.1
/100
|
#279
Tragic
25.9%
Cree
0.1
/100
|
#280
Tragic
25.9%
Immigrants | Honduras
0.1
/100
|
#281
Tragic
25.9%
Delaware
0.1
/100
|
#282
Tragic
25.9%
Spanish Americans
0.0
/100
|
#283
Tragic
25.9%
Immigrants | Azores
0.0
/100
|
#284
Tragic
26.0%
Immigrants | Congo
0.0
/100
|
#285
Tragic
26.0%