Nonimmigrants vs Immigrants from Ecuador Disability Age 35 to 64

COMPARE

Nonimmigrants
Race
Ancestry
AfghanAfricanAlaska NativeAlaskan AthabascanAlbanianAleutAlsatianAmericanApacheArabArapahoArgentineanArmenianAssyrian/Chaldean/SyriacAustralianAustrianBahamianBangladeshiBarbadianBasqueBelgianBelizeanBermudanBhutaneseBlackfeetBolivianBrazilianBritishBritish West IndianBulgarianBurmeseCajunCambodianCanadianCape VerdeanCarpatho RusynCelticCentral AmericanCentral American IndianCherokeeCheyenneChickasawChileanChineseChippewaChoctawColombianColvilleComancheCosta RicanCreeCreekCroatianCrowCubanCypriotCzechCzechoslovakianDanishDelawareDominicanDutchDutch West IndianEastern EuropeanEcuadorianEgyptianEnglishEstonianEthiopianEuropeanFijianFilipinoFinnishFrenchFrench American IndianFrench CanadianGermanGerman RussianGhanaianGreekGuamanian/ChamorroGuatemalanGuyaneseHaitianHmongHonduranHopiHoumaHungarianIcelanderIndian (Asian)IndonesianInupiatIranianIraqiIrishIroquoisIsraeliItalianJamaicanJapaneseJordanianKenyanKiowaKoreanLaotianLatvianLebaneseLiberianLithuanianLumbeeLuxembourgerMacedonianMalaysianMalteseMarshalleseMenomineeMexicanMexican American IndianMongolianMoroccanNative HawaiianNavajoNepaleseNew ZealanderNicaraguanNigerianNorthern EuropeanNorwegianOkinawanOsageOttawaPaiutePakistaniPalestinianPanamanianParaguayanPennsylvania GermanPeruvianPimaPolishPortuguesePotawatomiPuebloPuerto RicanPuget Sound SalishRomanianRussianSalvadoranSamoanScandinavianScotch-IrishScottishSeminoleSenegaleseSerbianShoshoneSierra LeoneanSiouxSlavicSlovakSloveneSomaliSouth AfricanSouth AmericanSouth American IndianSoviet UnionSpaniardSpanishSpanish AmericanSpanish American IndianSri LankanSubsaharan AfricanSudaneseSwedishSwissSyrianTaiwaneseThaiTlingit-HaidaTohono O'OdhamTonganTrinidadian and TobagonianTsimshianTurkishU.S. Virgin IslanderUgandanUkrainianUruguayanUteVenezuelanVietnameseWelshWest IndianYakamaYaquiYugoslavianYumanYup'ikZimbabwean
Immigration
NonimmigrantsImmigrantsAfghanistanAfricaAlbaniaArgentinaArmeniaAsiaAustraliaAustriaBahamasBangladeshBarbadosBelarusBelgiumBelizeBoliviaBosnia and HerzegovinaBrazilBulgariaBurma/MyanmarCabo VerdeCambodiaCameroonCanadaCaribbeanCentral AmericaChileChinaColombiaCongoCosta RicaCroatiaCubaCzechoslovakiaDenmarkDominicaDominican RepublicEastern AfricaEastern AsiaEastern EuropeEgyptEl SalvadorEnglandEritreaEthiopiaEuropeFijiFranceGermanyGhanaGreeceGrenadaGuatemalaGuyanaHaitiHondurasHong KongHungaryIndiaIndonesiaIranIraqIrelandIsraelItalyJamaicaJapanJordanKazakhstanKenyaKoreaKuwaitLaosLatin AmericaLatviaLebanonLiberiaLithuaniaMalaysiaMexicoMicronesiaMiddle AfricaMoldovaMoroccoNepalNetherlandsNicaraguaNigeriaNorth AmericaNorth MacedoniaNorthern AfricaNorthern EuropeNorwayOceaniaPakistanPanamaPeruPhilippinesPolandPortugalRomaniaRussiaSaudi ArabiaScotlandSenegalSerbiaSierra LeoneSingaporeSomaliaSouth AfricaSouth AmericaSouth Central AsiaSouth Eastern AsiaSouthern EuropeSpainSri LankaSt. Vincent and the GrenadinesSudanSwedenSwitzerlandSyriaTaiwanThailandTrinidad and TobagoTurkeyUgandaUkraineUruguayUzbekistanVenezuelaVietnamWest IndiesWestern AfricaWestern AsiaWestern EuropeYemenZaireZimbabweAzores
Immigrants from Ecuador
Race
Ancestry
AfghanAfricanAlaska NativeAlaskan AthabascanAlbanianAleutAlsatianAmericanApacheArabArapahoArgentineanArmenianAssyrian/Chaldean/SyriacAustralianAustrianBahamianBangladeshiBarbadianBasqueBelgianBelizeanBermudanBhutaneseBlackfeetBolivianBrazilianBritishBritish West IndianBulgarianBurmeseCajunCambodianCanadianCape VerdeanCarpatho RusynCelticCentral AmericanCentral American IndianCherokeeCheyenneChickasawChileanChineseChippewaChoctawColombianColvilleComancheCosta RicanCreeCreekCroatianCrowCubanCypriotCzechCzechoslovakianDanishDelawareDominicanDutchDutch West IndianEastern EuropeanEcuadorianEgyptianEnglishEstonianEthiopianEuropeanFijianFilipinoFinnishFrenchFrench American IndianFrench CanadianGermanGerman RussianGhanaianGreekGuamanian/ChamorroGuatemalanGuyaneseHaitianHmongHonduranHopiHoumaHungarianIcelanderIndian (Asian)IndonesianInupiatIranianIraqiIrishIroquoisIsraeliItalianJamaicanJapaneseJordanianKenyanKiowaKoreanLaotianLatvianLebaneseLiberianLithuanianLumbeeLuxembourgerMacedonianMalaysianMalteseMarshalleseMenomineeMexicanMexican American IndianMongolianMoroccanNative HawaiianNavajoNepaleseNew ZealanderNicaraguanNigerianNorthern EuropeanNorwegianOkinawanOsageOttawaPaiutePakistaniPalestinianPanamanianParaguayanPennsylvania GermanPeruvianPimaPolishPortuguesePotawatomiPuebloPuerto RicanPuget Sound SalishRomanianRussianSalvadoranSamoanScandinavianScotch-IrishScottishSeminoleSenegaleseSerbianShoshoneSierra LeoneanSiouxSlavicSlovakSloveneSomaliSouth AfricanSouth AmericanSouth American IndianSoviet UnionSpaniardSpanishSpanish AmericanSpanish American IndianSri LankanSubsaharan AfricanSudaneseSwedishSwissSyrianTaiwaneseThaiTlingit-HaidaTohono O'OdhamTonganTrinidadian and TobagonianTsimshianTurkishU.S. Virgin IslanderUgandanUkrainianUruguayanUteVenezuelanVietnameseWelshWest IndianYakamaYaquiYugoslavianYumanYup'ikZimbabwean
Immigration
ImmigrantsAfghanistanAfricaAlbaniaArgentinaArmeniaAsiaAustraliaAustriaBahamasBangladeshBarbadosBelarusBelgiumBelizeBoliviaBosnia and HerzegovinaBrazilBulgariaBurma/MyanmarCabo VerdeCambodiaCameroonCanadaCaribbeanCentral AmericaChileChinaColombiaCongoCosta RicaCroatiaCubaCzechoslovakiaDenmarkDominicaDominican RepublicEastern AfricaEastern AsiaEastern EuropeEcuadorEgyptEl SalvadorEnglandEritreaEthiopiaEuropeFijiFranceGermanyGhanaGreeceGrenadaGuatemalaGuyanaHaitiHondurasHong KongHungaryIndiaIndonesiaIranIraqIrelandIsraelItalyJamaicaJapanJordanKazakhstanKenyaKoreaKuwaitLaosLatin AmericaLatviaLebanonLiberiaLithuaniaMalaysiaMexicoMicronesiaMiddle AfricaMoldovaMoroccoNepalNetherlandsNicaraguaNigeriaNorth AmericaNorth MacedoniaNorthern AfricaNorthern EuropeNorwayOceaniaPakistanPanamaPeruPhilippinesPolandPortugalRomaniaRussiaSaudi ArabiaScotlandSenegalSerbiaSierra LeoneSingaporeSomaliaSouth AfricaSouth AmericaSouth Central AsiaSouth Eastern AsiaSouthern EuropeSpainSri LankaSt. Vincent and the GrenadinesSudanSwedenSwitzerlandSyriaTaiwanThailandTrinidad and TobagoTurkeyUgandaUkraineUruguayUzbekistanVenezuelaVietnamWest IndiesWestern AfricaWestern AsiaWestern EuropeYemenZaireZimbabweAzores
Disability Age 35 to 64
Income
Poverty
Unemployment
Labor Participation
Family Structure
Vehicle Availability
Education Level
Disability

Disability Age 35 to 64 Comparison

Nonimmigrants

Immigrants from Ecuador

Tragic
Exceptional
13.0%
DISABILITY AGE 35 TO 64
0.0/ 100
METRIC RATING
284th/ 347
METRIC RANK
10.7%
DISABILITY AGE 35 TO 64
92.5/ 100
METRIC RATING
134th/ 347
METRIC RANK

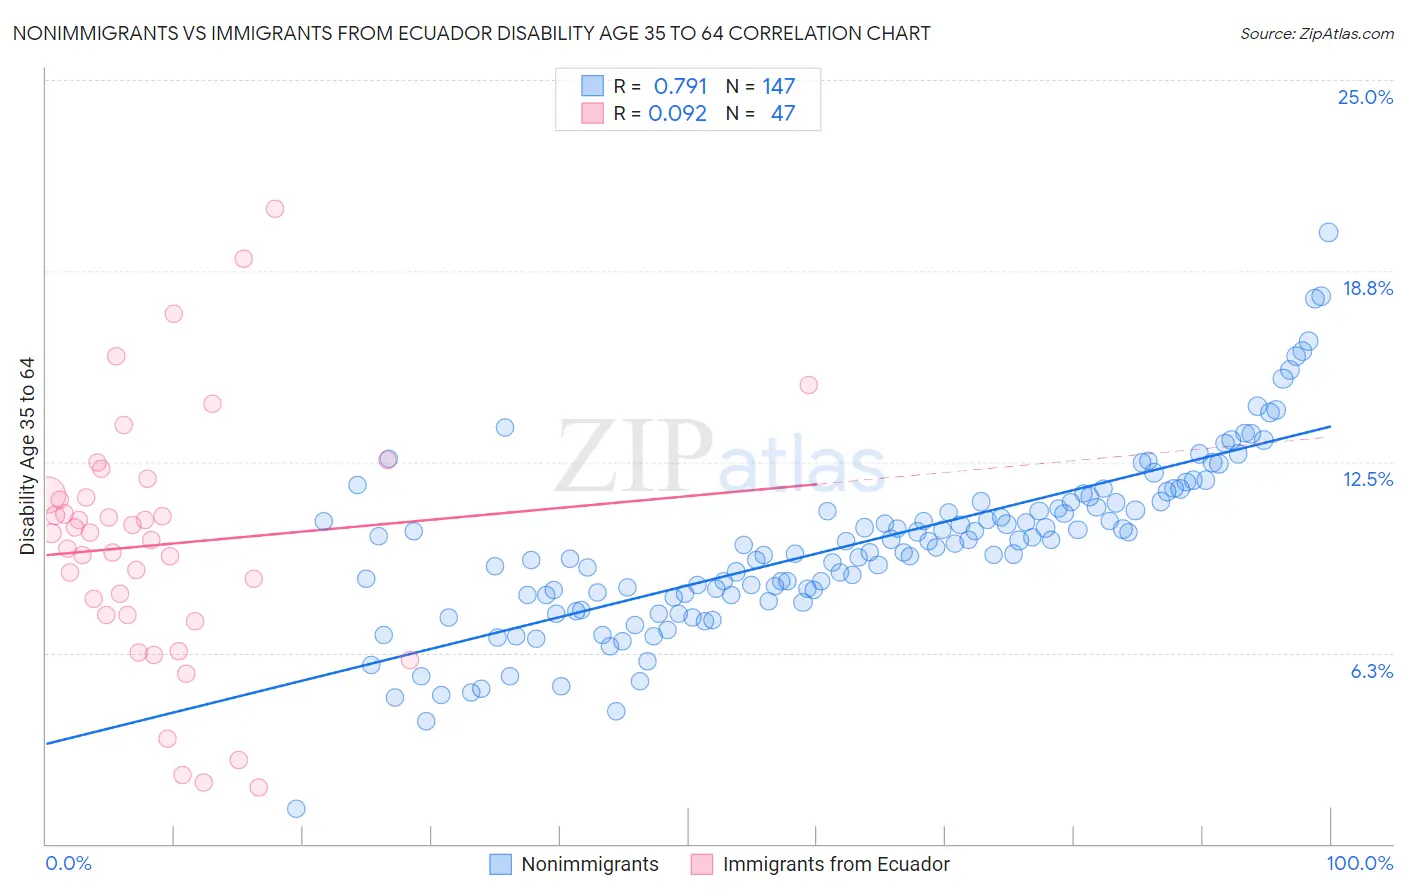
Nonimmigrants vs Immigrants from Ecuador Disability Age 35 to 64 Correlation Chart

The statistical analysis conducted on geographies consisting of 583,562,173 people shows a strong positive correlation between the proportion of Nonimmigrants and percentage of population with a disability between the ages 34 and 64 in the United States with a correlation coefficient (R) of 0.791 and weighted average of 13.0%. Similarly, the statistical analysis conducted on geographies consisting of 270,867,568 people shows a slight positive correlation between the proportion of Immigrants from Ecuador and percentage of population with a disability between the ages 34 and 64 in the United States with a correlation coefficient (R) of 0.092 and weighted average of 10.7%, a difference of 21.9%.
Nonimmigrants vs Immigrants from Ecuador Disability Age 35 to 64

Disability Age 35 to 64 Correlation Summary

MeasurementNonimmigrantsImmigrants from Ecuador
Minimum1.1%1.8%
Maximum20.0%20.8%
Range18.9%19.0%
Mean9.8%9.8%
Median9.8%10.2%
Interquartile 25% (IQ1)8.1%7.5%
Interquartile 75% (IQ3)11.2%11.4%
Interquartile Range (IQR)3.1%3.9%
Standard Deviation (Sample)2.9%4.1%
Standard Deviation (Population)2.9%4.1%

Similar Demographics by Disability Age 35 to 64

Demographics Similar to Nonimmigrants by Disability Age 35 to 64

In terms of disability age 35 to 64, the demographic groups most similar to Nonimmigrants are Central American Indian (13.0%, a difference of 0.14%), Immigrants from Somalia (13.1%, a difference of 0.44%), Immigrants from Laos (13.0%, a difference of 0.53%), Scotch-Irish (13.0%, a difference of 0.62%), and Hmong (13.1%, a difference of 0.75%).
DemographicsRating | RankDisability Age 35 to 64
Immigrants | Dominican Republic
0.1
/100
|
#277
Tragic
12.9%
French Canadians
0.1
/100
|
#278
Tragic
12.9%
Immigrants | Micronesia
0.1
/100
|
#279
Tragic
12.9%
Liberians
0.1
/100
|
#280
Tragic
12.9%
Scotch-Irish
0.1
/100
|
#281
Tragic
13.0%
Immigrants | Laos
0.1
/100
|
#282
Tragic
13.0%
Central American Indians
0.0
/100
|
#283
Tragic
13.0%
Immigrants | Nonimmigrants
0.0
/100
|
#284
Tragic
13.0%
Immigrants | Somalia
0.0
/100
|
#285
Tragic
13.1%
Hmong
0.0
/100
|
#286
Tragic
13.1%
Tlingit-Haida
0.0
/100
|
#287
Tragic
13.2%
Fijians
0.0
/100
|
#288
Tragic
13.2%
Indonesians
0.0
/100
|
#289
Tragic
13.2%
Immigrants | Liberia
0.0
/100
|
#290
Tragic
13.2%
Immigrants | Congo
0.0
/100
|
#291
Tragic
13.3%

Demographics Similar to Immigrants from Ecuador by Disability Age 35 to 64

In terms of disability age 35 to 64, the demographic groups most similar to Immigrants from Ecuador are Immigrants (10.7%, a difference of 0.0%), Immigrants from Albania (10.7%, a difference of 0.010%), Greek (10.7%, a difference of 0.050%), Immigrants from El Salvador (10.7%, a difference of 0.11%), and Salvadoran (10.7%, a difference of 0.16%).
DemographicsRating | RankDisability Age 35 to 64
Immigrants | Zimbabwe
94.0
/100
|
#127
Exceptional
10.6%
South Africans
93.3
/100
|
#128
Exceptional
10.7%
Ecuadorians
93.1
/100
|
#129
Exceptional
10.7%
Immigrants | Syria
93.0
/100
|
#130
Exceptional
10.7%
Immigrants | El Salvador
92.8
/100
|
#131
Exceptional
10.7%
Immigrants | Albania
92.5
/100
|
#132
Exceptional
10.7%
Immigrants | Immigrants
92.5
/100
|
#133
Exceptional
10.7%
Immigrants | Ecuador
92.5
/100
|
#134
Exceptional
10.7%
Greeks
92.3
/100
|
#135
Exceptional
10.7%
Salvadorans
91.9
/100
|
#136
Exceptional
10.7%
Immigrants | Costa Rica
91.7
/100
|
#137
Exceptional
10.7%
Immigrants | Southern Europe
91.5
/100
|
#138
Exceptional
10.7%
Costa Ricans
91.4
/100
|
#139
Exceptional
10.7%
Immigrants | Scotland
91.3
/100
|
#140
Exceptional
10.7%
Australians
90.7
/100
|
#141
Exceptional
10.8%