Laotian vs British Vision Disability
COMPARE
Laotian
British
Vision Disability
Vision Disability Comparison
Laotians
British
2.0%
VISION DISABILITY
99.3/ 100
METRIC RATING
55th/ 347
METRIC RANK
2.2%
VISION DISABILITY
25.1/ 100
METRIC RATING
193rd/ 347
METRIC RANK
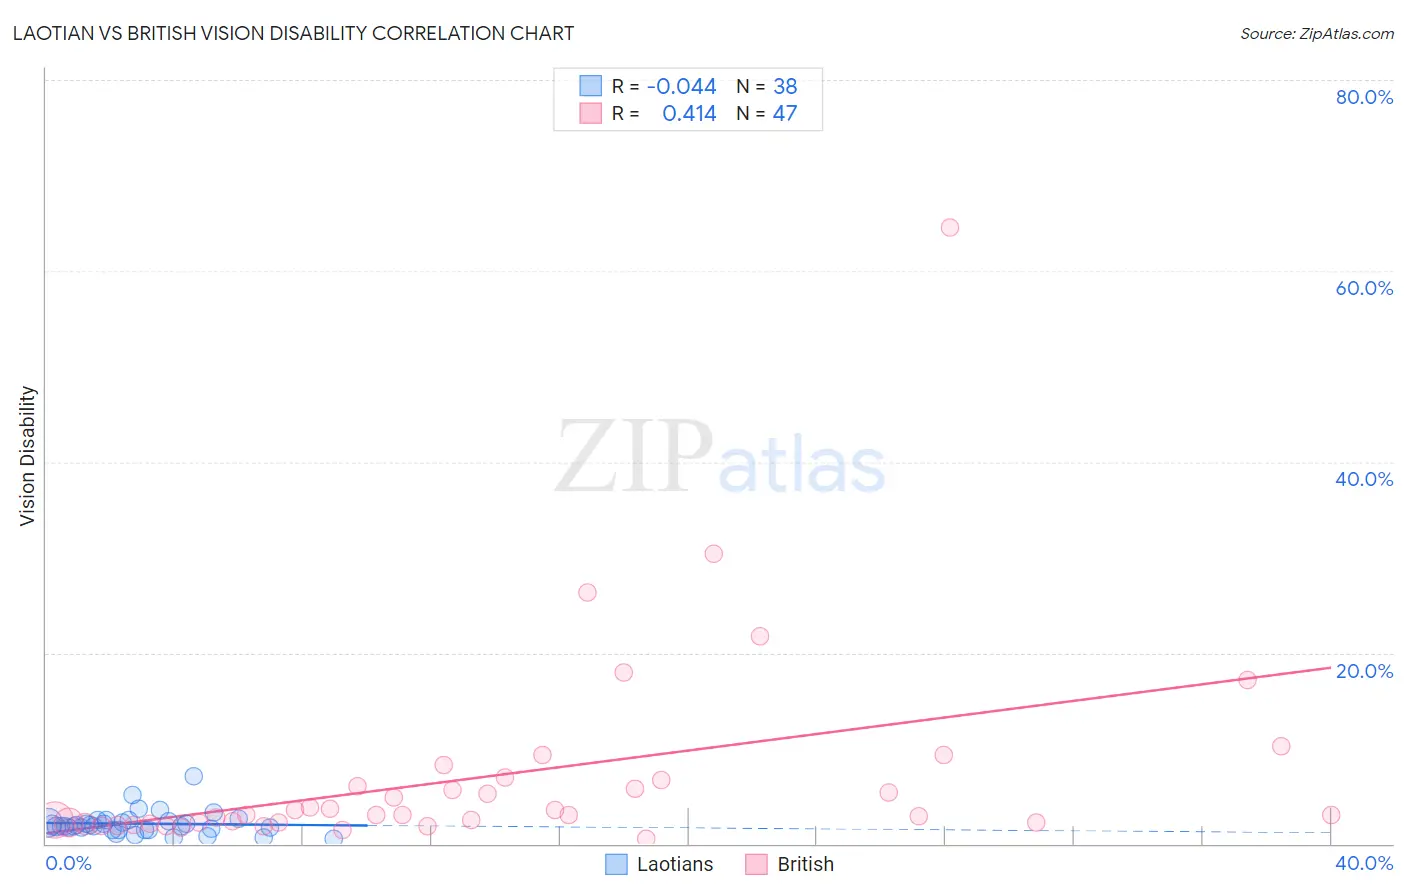
Laotian vs British Vision Disability Correlation Chart
The statistical analysis conducted on geographies consisting of 224,815,117 people shows no correlation between the proportion of Laotians and percentage of population with vision disability in the United States with a correlation coefficient (R) of -0.044 and weighted average of 2.0%. Similarly, the statistical analysis conducted on geographies consisting of 530,471,861 people shows a moderate positive correlation between the proportion of British and percentage of population with vision disability in the United States with a correlation coefficient (R) of 0.414 and weighted average of 2.2%, a difference of 10.4%.
Vision Disability Correlation Summary
| Measurement | Laotian | British |
| Minimum | 0.55% | 0.53% |
| Maximum | 7.1% | 64.6% |
| Range | 6.5% | 64.1% |
| Mean | 2.1% | 7.1% |
| Median | 1.9% | 3.0% |
| Interquartile 25% (IQ1) | 1.5% | 2.2% |
| Interquartile 75% (IQ3) | 2.4% | 6.6% |
| Interquartile Range (IQR) | 0.88% | 4.5% |
| Standard Deviation (Sample) | 1.2% | 10.8% |
| Standard Deviation (Population) | 1.2% | 10.7% |
Similar Demographics by Vision Disability
Demographics Similar to Laotians by Vision Disability
In terms of vision disability, the demographic groups most similar to Laotians are Macedonian (2.0%, a difference of 0.060%), Immigrants from Belarus (2.0%, a difference of 0.090%), Jordanian (2.0%, a difference of 0.17%), Somali (2.0%, a difference of 0.19%), and Immigrants from Serbia (2.0%, a difference of 0.21%).
| Demographics | Rating | Rank | Vision Disability |
| Israelis | 99.6 /100 | #48 | Exceptional 2.0% |
| Latvians | 99.5 /100 | #49 | Exceptional 2.0% |
| Afghans | 99.5 /100 | #50 | Exceptional 2.0% |
| Tongans | 99.5 /100 | #51 | Exceptional 2.0% |
| Immigrants | Serbia | 99.4 /100 | #52 | Exceptional 2.0% |
| Immigrants | Belarus | 99.3 /100 | #53 | Exceptional 2.0% |
| Macedonians | 99.3 /100 | #54 | Exceptional 2.0% |
| Laotians | 99.3 /100 | #55 | Exceptional 2.0% |
| Jordanians | 99.2 /100 | #56 | Exceptional 2.0% |
| Somalis | 99.2 /100 | #57 | Exceptional 2.0% |
| Immigrants | Saudi Arabia | 99.2 /100 | #58 | Exceptional 2.0% |
| Argentineans | 99.1 /100 | #59 | Exceptional 2.0% |
| Immigrants | Romania | 99.1 /100 | #60 | Exceptional 2.0% |
| Immigrants | Belgium | 99.1 /100 | #61 | Exceptional 2.0% |
| Immigrants | Russia | 99.1 /100 | #62 | Exceptional 2.0% |
Demographics Similar to British by Vision Disability
In terms of vision disability, the demographic groups most similar to British are European (2.2%, a difference of 0.050%), Canadian (2.2%, a difference of 0.060%), Immigrants from Costa Rica (2.2%, a difference of 0.080%), Immigrants from Barbados (2.2%, a difference of 0.090%), and Immigrants (2.2%, a difference of 0.11%).
| Demographics | Rating | Rank | Vision Disability |
| Native Hawaiians | 33.3 /100 | #186 | Fair 2.2% |
| Immigrants | St. Vincent and the Grenadines | 30.3 /100 | #187 | Fair 2.2% |
| Guyanese | 28.9 /100 | #188 | Fair 2.2% |
| Salvadorans | 27.4 /100 | #189 | Fair 2.2% |
| Immigrants | Costa Rica | 26.1 /100 | #190 | Fair 2.2% |
| Canadians | 25.8 /100 | #191 | Fair 2.2% |
| Europeans | 25.7 /100 | #192 | Fair 2.2% |
| British | 25.1 /100 | #193 | Fair 2.2% |
| Immigrants | Barbados | 24.0 /100 | #194 | Fair 2.2% |
| Immigrants | Immigrants | 23.7 /100 | #195 | Fair 2.2% |
| Immigrants | Grenada | 23.1 /100 | #196 | Fair 2.2% |
| Ghanaians | 21.8 /100 | #197 | Fair 2.2% |
| Czechoslovakians | 21.6 /100 | #198 | Fair 2.2% |
| Immigrants | El Salvador | 21.0 /100 | #199 | Fair 2.2% |
| Immigrants | Thailand | 20.1 /100 | #200 | Fair 2.2% |