Jordanian vs Guamanian/Chamorro Disability Age 65 to 74

COMPARE

Jordanian
Race
Ancestry
AfghanAfricanAlaska NativeAlaskan AthabascanAlbanianAleutAlsatianAmericanApacheArabArapahoArgentineanArmenianAssyrian/Chaldean/SyriacAustralianAustrianBahamianBangladeshiBarbadianBasqueBelgianBelizeanBermudanBhutaneseBlackfeetBolivianBrazilianBritishBritish West IndianBulgarianBurmeseCajunCambodianCanadianCape VerdeanCarpatho RusynCelticCentral AmericanCentral American IndianCherokeeCheyenneChickasawChileanChineseChippewaChoctawColombianColvilleComancheCosta RicanCreeCreekCroatianCrowCubanCypriotCzechCzechoslovakianDanishDelawareDominicanDutchDutch West IndianEastern EuropeanEcuadorianEgyptianEnglishEstonianEthiopianEuropeanFijianFilipinoFinnishFrenchFrench American IndianFrench CanadianGermanGerman RussianGhanaianGreekGuatemalanGuyaneseHaitianHmongHonduranHopiHoumaHungarianIcelanderIndian (Asian)IndonesianInupiatIranianIraqiIrishIroquoisIsraeliItalianJamaicanJapaneseJordanianKenyanKiowaKoreanLaotianLatvianLebaneseLiberianLithuanianLumbeeLuxembourgerMacedonianMalaysianMalteseMarshalleseMenomineeMexicanMexican American IndianMongolianMoroccanNative HawaiianNavajoNepaleseNew ZealanderNicaraguanNigerianNorthern EuropeanNorwegianOkinawanOsageOttawaPaiutePakistaniPalestinianPanamanianParaguayanPennsylvania GermanPeruvianPimaPolishPortuguesePotawatomiPuebloPuerto RicanPuget Sound SalishRomanianRussianSalvadoranSamoanScandinavianScotch-IrishScottishSeminoleSenegaleseSerbianShoshoneSierra LeoneanSiouxSlavicSlovakSloveneSomaliSouth AfricanSouth AmericanSouth American IndianSoviet UnionSpaniardSpanishSpanish AmericanSpanish American IndianSri LankanSubsaharan AfricanSudaneseSwedishSwissSyrianTaiwaneseThaiTlingit-HaidaTohono O'OdhamTonganTrinidadian and TobagonianTsimshianTurkishU.S. Virgin IslanderUgandanUkrainianUruguayanUteVenezuelanVietnameseWelshWest IndianYakamaYaquiYugoslavianYumanYup'ikZimbabwean
Immigration
NonimmigrantsImmigrantsAfghanistanAfricaAlbaniaArgentinaArmeniaAsiaAustraliaAustriaBahamasBangladeshBarbadosBelarusBelgiumBelizeBoliviaBosnia and HerzegovinaBrazilBulgariaBurma/MyanmarCabo VerdeCambodiaCameroonCanadaCaribbeanCentral AmericaChileChinaColombiaCongoCosta RicaCroatiaCubaCzechoslovakiaDenmarkDominicaDominican RepublicEastern AfricaEastern AsiaEastern EuropeEcuadorEgyptEl SalvadorEnglandEritreaEthiopiaEuropeFijiFranceGermanyGhanaGreeceGrenadaGuatemalaGuyanaHaitiHondurasHong KongHungaryIndiaIndonesiaIranIraqIrelandIsraelItalyJamaicaJapanJordanKazakhstanKenyaKoreaKuwaitLaosLatin AmericaLatviaLebanonLiberiaLithuaniaMalaysiaMexicoMicronesiaMiddle AfricaMoldovaMoroccoNepalNetherlandsNicaraguaNigeriaNorth AmericaNorth MacedoniaNorthern AfricaNorthern EuropeNorwayOceaniaPakistanPanamaPeruPhilippinesPolandPortugalRomaniaRussiaSaudi ArabiaScotlandSenegalSerbiaSierra LeoneSingaporeSomaliaSouth AfricaSouth AmericaSouth Central AsiaSouth Eastern AsiaSouthern EuropeSpainSri LankaSt. Vincent and the GrenadinesSudanSwedenSwitzerlandSyriaTaiwanThailandTrinidad and TobagoTurkeyUgandaUkraineUruguayUzbekistanVenezuelaVietnamWest IndiesWestern AfricaWestern AsiaWestern EuropeYemenZaireZimbabweAzores
Guamanian/Chamorro
Race
Ancestry
AfghanAfricanAlaska NativeAlaskan AthabascanAlbanianAleutAlsatianAmericanApacheArabArapahoArgentineanArmenianAssyrian/Chaldean/SyriacAustralianAustrianBahamianBangladeshiBarbadianBasqueBelgianBelizeanBermudanBhutaneseBlackfeetBolivianBrazilianBritishBritish West IndianBulgarianBurmeseCajunCambodianCanadianCape VerdeanCarpatho RusynCelticCentral AmericanCentral American IndianCherokeeCheyenneChickasawChileanChineseChippewaChoctawColombianColvilleComancheCosta RicanCreeCreekCroatianCrowCubanCypriotCzechCzechoslovakianDanishDelawareDominicanDutchDutch West IndianEastern EuropeanEcuadorianEgyptianEnglishEstonianEthiopianEuropeanFijianFilipinoFinnishFrenchFrench American IndianFrench CanadianGermanGerman RussianGhanaianGreekGuamanian/ChamorroGuatemalanGuyaneseHaitianHmongHonduranHopiHoumaHungarianIcelanderIndian (Asian)IndonesianInupiatIranianIraqiIrishIroquoisIsraeliItalianJamaicanJapaneseKenyanKiowaKoreanLaotianLatvianLebaneseLiberianLithuanianLumbeeLuxembourgerMacedonianMalaysianMalteseMarshalleseMenomineeMexicanMexican American IndianMongolianMoroccanNative HawaiianNavajoNepaleseNew ZealanderNicaraguanNigerianNorthern EuropeanNorwegianOkinawanOsageOttawaPaiutePakistaniPalestinianPanamanianParaguayanPennsylvania GermanPeruvianPimaPolishPortuguesePotawatomiPuebloPuerto RicanPuget Sound SalishRomanianRussianSalvadoranSamoanScandinavianScotch-IrishScottishSeminoleSenegaleseSerbianShoshoneSierra LeoneanSiouxSlavicSlovakSloveneSomaliSouth AfricanSouth AmericanSouth American IndianSoviet UnionSpaniardSpanishSpanish AmericanSpanish American IndianSri LankanSubsaharan AfricanSudaneseSwedishSwissSyrianTaiwaneseThaiTlingit-HaidaTohono O'OdhamTonganTrinidadian and TobagonianTsimshianTurkishU.S. Virgin IslanderUgandanUkrainianUruguayanUteVenezuelanVietnameseWelshWest IndianYakamaYaquiYugoslavianYumanYup'ikZimbabwean
Immigration
NonimmigrantsImmigrantsAfghanistanAfricaAlbaniaArgentinaArmeniaAsiaAustraliaAustriaBahamasBangladeshBarbadosBelarusBelgiumBelizeBoliviaBosnia and HerzegovinaBrazilBulgariaBurma/MyanmarCabo VerdeCambodiaCameroonCanadaCaribbeanCentral AmericaChileChinaColombiaCongoCosta RicaCroatiaCubaCzechoslovakiaDenmarkDominicaDominican RepublicEastern AfricaEastern AsiaEastern EuropeEcuadorEgyptEl SalvadorEnglandEritreaEthiopiaEuropeFijiFranceGermanyGhanaGreeceGrenadaGuatemalaGuyanaHaitiHondurasHong KongHungaryIndiaIndonesiaIranIraqIrelandIsraelItalyJamaicaJapanJordanKazakhstanKenyaKoreaKuwaitLaosLatin AmericaLatviaLebanonLiberiaLithuaniaMalaysiaMexicoMicronesiaMiddle AfricaMoldovaMoroccoNepalNetherlandsNicaraguaNigeriaNorth AmericaNorth MacedoniaNorthern AfricaNorthern EuropeNorwayOceaniaPakistanPanamaPeruPhilippinesPolandPortugalRomaniaRussiaSaudi ArabiaScotlandSenegalSerbiaSierra LeoneSingaporeSomaliaSouth AfricaSouth AmericaSouth Central AsiaSouth Eastern AsiaSouthern EuropeSpainSri LankaSt. Vincent and the GrenadinesSudanSwedenSwitzerlandSyriaTaiwanThailandTrinidad and TobagoTurkeyUgandaUkraineUruguayUzbekistanVenezuelaVietnamWest IndiesWestern AfricaWestern AsiaWestern EuropeYemenZaireZimbabweAzores
Disability Age 65 to 74
Income
Poverty
Unemployment
Labor Participation
Family Structure
Vehicle Availability
Education Level
Disability

Disability Age 65 to 74 Comparison

Jordanians

Guamanians/Chamorros

Exceptional
Tragic
22.2%
DISABILITY AGE 65 TO 74
96.9/ 100
METRIC RATING
98th/ 347
METRIC RANK
25.3%
DISABILITY AGE 65 TO 74
0.3/ 100
METRIC RATING
257th/ 347
METRIC RANK

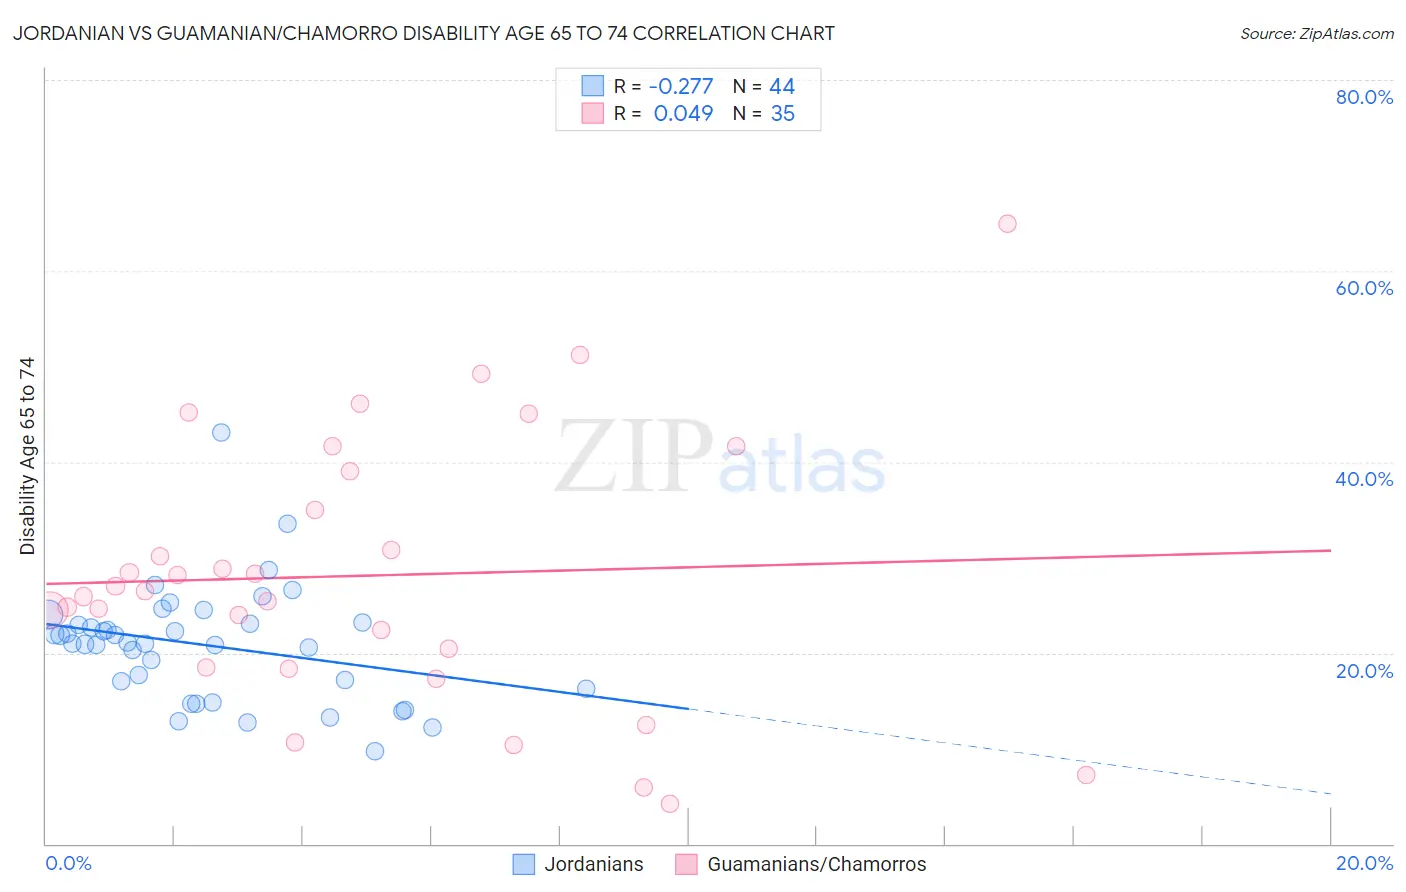
Jordanian vs Guamanian/Chamorro Disability Age 65 to 74 Correlation Chart

The statistical analysis conducted on geographies consisting of 166,340,353 people shows a weak negative correlation between the proportion of Jordanians and percentage of population with a disability between the ages 65 and 75 in the United States with a correlation coefficient (R) of -0.277 and weighted average of 22.2%. Similarly, the statistical analysis conducted on geographies consisting of 221,467,649 people shows no correlation between the proportion of Guamanians/Chamorros and percentage of population with a disability between the ages 65 and 75 in the United States with a correlation coefficient (R) of 0.049 and weighted average of 25.3%, a difference of 14.0%.
Jordanian vs Guamanian/Chamorro Disability Age 65 to 74

Disability Age 65 to 74 Correlation Summary

MeasurementJordanianGuamanian/Chamorro
Minimum9.7%4.2%
Maximum43.1%65.0%
Range33.4%60.8%
Mean20.8%28.1%
Median21.0%26.4%
Interquartile 25% (IQ1)16.6%18.5%
Interquartile 75% (IQ3)23.1%39.0%
Interquartile Range (IQR)6.5%20.5%
Standard Deviation (Sample)6.0%14.0%
Standard Deviation (Population)6.0%13.8%

Similar Demographics by Disability Age 65 to 74

Demographics Similar to Jordanians by Disability Age 65 to 74

In terms of disability age 65 to 74, the demographic groups most similar to Jordanians are Immigrants from Colombia (22.2%, a difference of 0.030%), Uruguayan (22.2%, a difference of 0.16%), Immigrants from England (22.2%, a difference of 0.17%), Immigrants from Saudi Arabia (22.2%, a difference of 0.20%), and Immigrants from Southern Europe (22.1%, a difference of 0.21%).
DemographicsRating | RankDisability Age 65 to 74
Chileans
97.9
/100
|
#91
Exceptional
22.0%
Poles
97.8
/100
|
#92
Exceptional
22.0%
Immigrants | Canada
97.8
/100
|
#93
Exceptional
22.1%
Immigrants | Chile
97.7
/100
|
#94
Exceptional
22.1%
Romanians
97.7
/100
|
#95
Exceptional
22.1%
Immigrants | North America
97.5
/100
|
#96
Exceptional
22.1%
Immigrants | Southern Europe
97.2
/100
|
#97
Exceptional
22.1%
Jordanians
96.9
/100
|
#98
Exceptional
22.2%
Immigrants | Colombia
96.8
/100
|
#99
Exceptional
22.2%
Uruguayans
96.5
/100
|
#100
Exceptional
22.2%
Immigrants | England
96.5
/100
|
#101
Exceptional
22.2%
Immigrants | Saudi Arabia
96.4
/100
|
#102
Exceptional
22.2%
South Americans
96.4
/100
|
#103
Exceptional
22.2%
Colombians
96.4
/100
|
#104
Exceptional
22.2%
Palestinians
96.3
/100
|
#105
Exceptional
22.2%

Demographics Similar to Guamanians/Chamorros by Disability Age 65 to 74

In terms of disability age 65 to 74, the demographic groups most similar to Guamanians/Chamorros are Marshallese (25.3%, a difference of 0.060%), Immigrants from Cambodia (25.3%, a difference of 0.15%), Immigrants from Somalia (25.2%, a difference of 0.17%), Malaysian (25.4%, a difference of 0.47%), and Cape Verdean (25.4%, a difference of 0.55%).
DemographicsRating | RankDisability Age 65 to 74
Salvadorans
0.8
/100
|
#250
Tragic
25.0%
Immigrants | Nonimmigrants
0.7
/100
|
#251
Tragic
25.0%
Immigrants | El Salvador
0.6
/100
|
#252
Tragic
25.1%
Sub-Saharan Africans
0.6
/100
|
#253
Tragic
25.1%
Somalis
0.6
/100
|
#254
Tragic
25.1%
Central Americans
0.5
/100
|
#255
Tragic
25.1%
Immigrants | Somalia
0.4
/100
|
#256
Tragic
25.2%
Guamanians/Chamorros
0.3
/100
|
#257
Tragic
25.3%
Marshallese
0.3
/100
|
#258
Tragic
25.3%
Immigrants | Cambodia
0.3
/100
|
#259
Tragic
25.3%
Malaysians
0.2
/100
|
#260
Tragic
25.4%
Cape Verdeans
0.2
/100
|
#261
Tragic
25.4%
Samoans
0.2
/100
|
#262
Tragic
25.4%
Iroquois
0.2
/100
|
#263
Tragic
25.4%
Hawaiians
0.2
/100
|
#264
Tragic
25.5%