Immigrants from Zaire vs Immigrants from South Central Asia Male Disability

COMPARE

Immigrants from Zaire
Race
Ancestry
AfghanAfricanAlaska NativeAlaskan AthabascanAlbanianAleutAlsatianAmericanApacheArabArapahoArgentineanArmenianAssyrian/Chaldean/SyriacAustralianAustrianBahamianBangladeshiBarbadianBasqueBelgianBelizeanBermudanBhutaneseBlackfeetBolivianBrazilianBritishBritish West IndianBulgarianBurmeseCajunCambodianCanadianCape VerdeanCarpatho RusynCelticCentral AmericanCentral American IndianCherokeeCheyenneChickasawChileanChineseChippewaChoctawColombianColvilleComancheCosta RicanCreeCreekCroatianCrowCubanCypriotCzechCzechoslovakianDanishDelawareDominicanDutchDutch West IndianEastern EuropeanEcuadorianEgyptianEnglishEstonianEthiopianEuropeanFijianFilipinoFinnishFrenchFrench American IndianFrench CanadianGermanGerman RussianGhanaianGreekGuamanian/ChamorroGuatemalanGuyaneseHaitianHmongHonduranHopiHoumaHungarianIcelanderIndian (Asian)IndonesianInupiatIranianIraqiIrishIroquoisIsraeliItalianJamaicanJapaneseJordanianKenyanKiowaKoreanLaotianLatvianLebaneseLiberianLithuanianLumbeeLuxembourgerMacedonianMalaysianMalteseMarshalleseMenomineeMexicanMexican American IndianMongolianMoroccanNative HawaiianNavajoNepaleseNew ZealanderNicaraguanNigerianNorthern EuropeanNorwegianOkinawanOsageOttawaPaiutePakistaniPalestinianPanamanianParaguayanPennsylvania GermanPeruvianPimaPolishPortuguesePotawatomiPuebloPuerto RicanPuget Sound SalishRomanianRussianSalvadoranSamoanScandinavianScotch-IrishScottishSeminoleSenegaleseSerbianShoshoneSierra LeoneanSiouxSlavicSlovakSloveneSomaliSouth AfricanSouth AmericanSouth American IndianSoviet UnionSpaniardSpanishSpanish AmericanSpanish American IndianSri LankanSubsaharan AfricanSudaneseSwedishSwissSyrianTaiwaneseThaiTlingit-HaidaTohono O'OdhamTonganTrinidadian and TobagonianTsimshianTurkishU.S. Virgin IslanderUgandanUkrainianUruguayanUteVenezuelanVietnameseWelshWest IndianYakamaYaquiYugoslavianYumanYup'ikZimbabwean
Immigration
NonimmigrantsImmigrantsAfghanistanAfricaAlbaniaArgentinaArmeniaAsiaAustraliaAustriaBahamasBangladeshBarbadosBelarusBelgiumBelizeBoliviaBosnia and HerzegovinaBrazilBulgariaBurma/MyanmarCabo VerdeCambodiaCameroonCanadaCaribbeanCentral AmericaChileChinaColombiaCongoCosta RicaCroatiaCubaCzechoslovakiaDenmarkDominicaDominican RepublicEastern AfricaEastern AsiaEastern EuropeEcuadorEgyptEl SalvadorEnglandEritreaEthiopiaEuropeFijiFranceGermanyGhanaGreeceGrenadaGuatemalaGuyanaHaitiHondurasHong KongHungaryIndiaIndonesiaIranIraqIrelandIsraelItalyJamaicaJapanJordanKazakhstanKenyaKoreaKuwaitLaosLatin AmericaLatviaLebanonLiberiaLithuaniaMalaysiaMexicoMicronesiaMiddle AfricaMoldovaMoroccoNepalNetherlandsNicaraguaNigeriaNorth AmericaNorth MacedoniaNorthern AfricaNorthern EuropeNorwayOceaniaPakistanPanamaPeruPhilippinesPolandPortugalRomaniaRussiaSaudi ArabiaScotlandSenegalSerbiaSierra LeoneSingaporeSomaliaSouth AfricaSouth AmericaSouth Eastern AsiaSouthern EuropeSpainSri LankaSt. Vincent and the GrenadinesSudanSwedenSwitzerlandSyriaTaiwanThailandTrinidad and TobagoTurkeyUgandaUkraineUruguayUzbekistanVenezuelaVietnamWest IndiesWestern AfricaWestern AsiaWestern EuropeYemenZaireZimbabweAzores
Immigrants from South Central Asia
Race
Ancestry
AfghanAfricanAlaska NativeAlaskan AthabascanAlbanianAleutAlsatianAmericanApacheArabArapahoArgentineanArmenianAssyrian/Chaldean/SyriacAustralianAustrianBahamianBangladeshiBarbadianBasqueBelgianBelizeanBermudanBhutaneseBlackfeetBolivianBrazilianBritishBritish West IndianBulgarianBurmeseCajunCambodianCanadianCape VerdeanCarpatho RusynCelticCentral AmericanCentral American IndianCherokeeCheyenneChickasawChileanChineseChippewaChoctawColombianColvilleComancheCosta RicanCreeCreekCroatianCrowCubanCypriotCzechCzechoslovakianDanishDelawareDominicanDutchDutch West IndianEastern EuropeanEcuadorianEgyptianEnglishEstonianEthiopianEuropeanFijianFilipinoFinnishFrenchFrench American IndianFrench CanadianGermanGerman RussianGhanaianGreekGuamanian/ChamorroGuatemalanGuyaneseHaitianHmongHonduranHopiHoumaHungarianIcelanderIndian (Asian)IndonesianInupiatIranianIraqiIrishIroquoisIsraeliItalianJamaicanJapaneseJordanianKenyanKiowaKoreanLaotianLatvianLebaneseLiberianLithuanianLumbeeLuxembourgerMacedonianMalaysianMalteseMarshalleseMenomineeMexicanMexican American IndianMongolianMoroccanNative HawaiianNavajoNepaleseNew ZealanderNicaraguanNigerianNorthern EuropeanNorwegianOkinawanOsageOttawaPaiutePakistaniPalestinianPanamanianParaguayanPennsylvania GermanPeruvianPimaPolishPortuguesePotawatomiPuebloPuerto RicanPuget Sound SalishRomanianRussianSalvadoranSamoanScandinavianScotch-IrishScottishSeminoleSenegaleseSerbianShoshoneSierra LeoneanSiouxSlavicSlovakSloveneSomaliSouth AfricanSouth AmericanSouth American IndianSoviet UnionSpaniardSpanishSpanish AmericanSpanish American IndianSri LankanSubsaharan AfricanSudaneseSwedishSwissSyrianTaiwaneseThaiTlingit-HaidaTohono O'OdhamTonganTrinidadian and TobagonianTsimshianTurkishU.S. Virgin IslanderUgandanUkrainianUruguayanUteVenezuelanVietnameseWelshWest IndianYakamaYaquiYugoslavianYumanYup'ikZimbabwean
Immigration
NonimmigrantsImmigrantsAfghanistanAfricaAlbaniaArgentinaArmeniaAsiaAustraliaAustriaBahamasBangladeshBarbadosBelarusBelgiumBelizeBoliviaBosnia and HerzegovinaBrazilBulgariaBurma/MyanmarCabo VerdeCambodiaCameroonCanadaCaribbeanCentral AmericaChileChinaColombiaCongoCosta RicaCroatiaCubaCzechoslovakiaDenmarkDominicaDominican RepublicEastern AfricaEastern AsiaEastern EuropeEcuadorEgyptEl SalvadorEnglandEritreaEthiopiaEuropeFijiFranceGermanyGhanaGreeceGrenadaGuatemalaGuyanaHaitiHondurasHong KongHungaryIndiaIndonesiaIranIraqIrelandIsraelItalyJamaicaJapanJordanKazakhstanKenyaKoreaKuwaitLaosLatin AmericaLatviaLebanonLiberiaLithuaniaMalaysiaMexicoMicronesiaMiddle AfricaMoldovaMoroccoNepalNetherlandsNicaraguaNigeriaNorth AmericaNorth MacedoniaNorthern AfricaNorthern EuropeNorwayOceaniaPakistanPanamaPeruPhilippinesPolandPortugalRomaniaRussiaSaudi ArabiaScotlandSenegalSerbiaSierra LeoneSingaporeSomaliaSouth AfricaSouth AmericaSouth Central AsiaSouth Eastern AsiaSouthern EuropeSpainSri LankaSt. Vincent and the GrenadinesSudanSwedenSwitzerlandSyriaTaiwanThailandTrinidad and TobagoTurkeyUgandaUkraineUruguayUzbekistanVenezuelaVietnamWest IndiesWestern AfricaWestern AsiaWestern EuropeYemenZimbabweAzores
Male Disability
Income
Poverty
Unemployment
Labor Participation
Family Structure
Vehicle Availability
Education Level
Disability

Male Disability Comparison

Immigrants from Zaire

Immigrants from South Central Asia

Fair
Exceptional
11.4%
MALE DISABILITY
27.6/ 100
METRIC RATING
186th/ 347
METRIC RANK
9.4%
MALE DISABILITY
100.0/ 100
METRIC RATING
6th/ 347
METRIC RANK

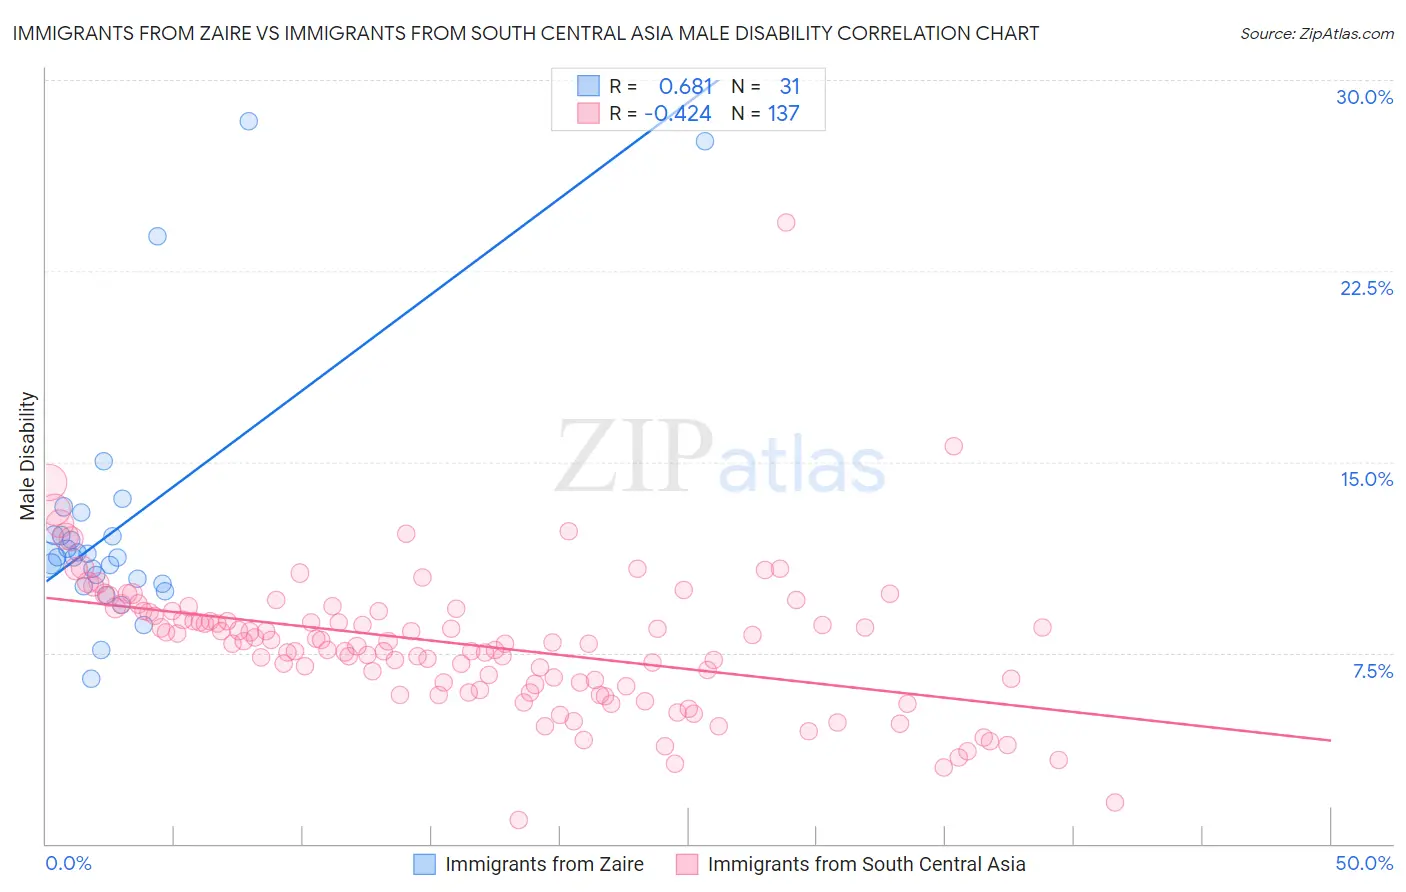
Immigrants from Zaire vs Immigrants from South Central Asia Male Disability Correlation Chart

The statistical analysis conducted on geographies consisting of 107,255,080 people shows a significant positive correlation between the proportion of Immigrants from Zaire and percentage of males with a disability in the United States with a correlation coefficient (R) of 0.681 and weighted average of 11.4%. Similarly, the statistical analysis conducted on geographies consisting of 473,016,937 people shows a moderate negative correlation between the proportion of Immigrants from South Central Asia and percentage of males with a disability in the United States with a correlation coefficient (R) of -0.424 and weighted average of 9.4%, a difference of 20.5%.
Immigrants from Zaire vs Immigrants from South Central Asia Male Disability

Male Disability Correlation Summary

MeasurementImmigrants from ZaireImmigrants from South Central Asia
Minimum6.5%0.93%
Maximum28.4%24.4%
Range21.9%23.5%
Mean12.5%7.8%
Median11.2%7.9%
Interquartile 25% (IQ1)10.2%6.2%
Interquartile 75% (IQ3)12.1%9.1%
Interquartile Range (IQR)1.9%2.9%
Standard Deviation (Sample)5.0%2.8%
Standard Deviation (Population)4.9%2.8%

Similar Demographics by Male Disability

Demographics Similar to Immigrants from Zaire by Male Disability

In terms of male disability, the demographic groups most similar to Immigrants from Zaire are Immigrants from Austria (11.4%, a difference of 0.020%), Estonian (11.4%, a difference of 0.060%), Immigrants from Netherlands (11.4%, a difference of 0.12%), Immigrants from Bosnia and Herzegovina (11.4%, a difference of 0.16%), and Pakistani (11.3%, a difference of 0.18%).
DemographicsRating | RankMale Disability
Immigrants | Caribbean
41.4
/100
|
#179
Average
11.3%
Hondurans
41.1
/100
|
#180
Average
11.3%
Immigrants | Senegal
34.4
/100
|
#181
Fair
11.3%
Immigrants | Belize
33.7
/100
|
#182
Fair
11.3%
Immigrants | Central America
32.9
/100
|
#183
Fair
11.3%
Iraqis
30.5
/100
|
#184
Fair
11.3%
Pakistanis
30.3
/100
|
#185
Fair
11.3%
Immigrants | Zaire
27.6
/100
|
#186
Fair
11.4%
Immigrants | Austria
27.3
/100
|
#187
Fair
11.4%
Estonians
26.8
/100
|
#188
Fair
11.4%
Immigrants | Netherlands
25.9
/100
|
#189
Fair
11.4%
Immigrants | Bosnia and Herzegovina
25.4
/100
|
#190
Fair
11.4%
Senegalese
23.2
/100
|
#191
Fair
11.4%
Assyrians/Chaldeans/Syriacs
23.2
/100
|
#192
Fair
11.4%
Greeks
22.2
/100
|
#193
Fair
11.4%

Demographics Similar to Immigrants from South Central Asia by Male Disability

In terms of male disability, the demographic groups most similar to Immigrants from South Central Asia are Immigrants from Hong Kong (9.4%, a difference of 0.060%), Immigrants from Bolivia (9.5%, a difference of 0.33%), Immigrants from China (9.5%, a difference of 0.93%), Immigrants from Singapore (9.5%, a difference of 1.0%), and Immigrants from Israel (9.6%, a difference of 1.4%).
DemographicsRating | RankMale Disability
Immigrants | India
100.0
/100
|
#1
Exceptional
9.0%
Immigrants | Taiwan
100.0
/100
|
#2
Exceptional
9.1%
Filipinos
100.0
/100
|
#3
Exceptional
9.1%
Thais
100.0
/100
|
#4
Exceptional
9.2%
Immigrants | Hong Kong
100.0
/100
|
#5
Exceptional
9.4%
Immigrants | South Central Asia
100.0
/100
|
#6
Exceptional
9.4%
Immigrants | Bolivia
100.0
/100
|
#7
Exceptional
9.5%
Immigrants | China
100.0
/100
|
#8
Exceptional
9.5%
Immigrants | Singapore
100.0
/100
|
#9
Exceptional
9.5%
Immigrants | Israel
100.0
/100
|
#10
Exceptional
9.6%
Immigrants | Eastern Asia
100.0
/100
|
#11
Exceptional
9.6%
Bolivians
100.0
/100
|
#12
Exceptional
9.6%
Iranians
100.0
/100
|
#13
Exceptional
9.7%
Immigrants | Iran
100.0
/100
|
#14
Exceptional
9.7%
Indians (Asian)
100.0
/100
|
#15
Exceptional
9.7%