Cuban vs Immigrants from South Central Asia Male Disability

COMPARE

Cuban
Race
Ancestry
AfghanAfricanAlaska NativeAlaskan AthabascanAlbanianAleutAlsatianAmericanApacheArabArapahoArgentineanArmenianAssyrian/Chaldean/SyriacAustralianAustrianBahamianBangladeshiBarbadianBasqueBelgianBelizeanBermudanBhutaneseBlackfeetBolivianBrazilianBritishBritish West IndianBulgarianBurmeseCajunCambodianCanadianCape VerdeanCarpatho RusynCelticCentral AmericanCentral American IndianCherokeeCheyenneChickasawChileanChineseChippewaChoctawColombianColvilleComancheCosta RicanCreeCreekCroatianCrowCubanCypriotCzechCzechoslovakianDanishDelawareDominicanDutchDutch West IndianEastern EuropeanEcuadorianEgyptianEnglishEstonianEthiopianEuropeanFijianFilipinoFinnishFrenchFrench American IndianFrench CanadianGermanGerman RussianGhanaianGreekGuamanian/ChamorroGuatemalanGuyaneseHaitianHmongHonduranHopiHoumaHungarianIcelanderIndian (Asian)IndonesianInupiatIranianIraqiIrishIroquoisIsraeliItalianJamaicanJapaneseJordanianKenyanKiowaKoreanLaotianLatvianLebaneseLiberianLithuanianLumbeeLuxembourgerMacedonianMalaysianMalteseMarshalleseMenomineeMexicanMexican American IndianMongolianMoroccanNative HawaiianNavajoNepaleseNew ZealanderNicaraguanNigerianNorthern EuropeanNorwegianOkinawanOsageOttawaPaiutePakistaniPalestinianPanamanianParaguayanPennsylvania GermanPeruvianPimaPolishPortuguesePotawatomiPuebloPuerto RicanPuget Sound SalishRomanianRussianSalvadoranSamoanScandinavianScotch-IrishScottishSeminoleSenegaleseSerbianShoshoneSierra LeoneanSiouxSlavicSlovakSloveneSomaliSouth AfricanSouth AmericanSouth American IndianSoviet UnionSpaniardSpanishSpanish AmericanSpanish American IndianSri LankanSubsaharan AfricanSudaneseSwedishSwissSyrianTaiwaneseThaiTlingit-HaidaTohono O'OdhamTonganTrinidadian and TobagonianTsimshianTurkishU.S. Virgin IslanderUgandanUkrainianUruguayanUteVenezuelanVietnameseWelshWest IndianYakamaYaquiYugoslavianYumanYup'ikZimbabwean
Immigration
NonimmigrantsImmigrantsAfghanistanAfricaAlbaniaArgentinaArmeniaAsiaAustraliaAustriaBahamasBangladeshBarbadosBelarusBelgiumBelizeBoliviaBosnia and HerzegovinaBrazilBulgariaBurma/MyanmarCabo VerdeCambodiaCameroonCanadaCaribbeanCentral AmericaChileChinaColombiaCongoCosta RicaCroatiaCubaCzechoslovakiaDenmarkDominicaDominican RepublicEastern AfricaEastern AsiaEastern EuropeEcuadorEgyptEl SalvadorEnglandEritreaEthiopiaEuropeFijiFranceGermanyGhanaGreeceGrenadaGuatemalaGuyanaHaitiHondurasHong KongHungaryIndiaIndonesiaIranIraqIrelandIsraelItalyJamaicaJapanJordanKazakhstanKenyaKoreaKuwaitLaosLatin AmericaLatviaLebanonLiberiaLithuaniaMalaysiaMexicoMicronesiaMiddle AfricaMoldovaMoroccoNepalNetherlandsNicaraguaNigeriaNorth AmericaNorth MacedoniaNorthern AfricaNorthern EuropeNorwayOceaniaPakistanPanamaPeruPhilippinesPolandPortugalRomaniaRussiaSaudi ArabiaScotlandSenegalSerbiaSierra LeoneSingaporeSomaliaSouth AfricaSouth AmericaSouth Eastern AsiaSouthern EuropeSpainSri LankaSt. Vincent and the GrenadinesSudanSwedenSwitzerlandSyriaTaiwanThailandTrinidad and TobagoTurkeyUgandaUkraineUruguayUzbekistanVenezuelaVietnamWest IndiesWestern AfricaWestern AsiaWestern EuropeYemenZaireZimbabweAzores
Immigrants from South Central Asia
Race
Ancestry
AfghanAfricanAlaska NativeAlaskan AthabascanAlbanianAleutAlsatianAmericanApacheArabArapahoArgentineanArmenianAssyrian/Chaldean/SyriacAustralianAustrianBahamianBangladeshiBarbadianBasqueBelgianBelizeanBermudanBhutaneseBlackfeetBolivianBrazilianBritishBritish West IndianBulgarianBurmeseCajunCambodianCanadianCape VerdeanCarpatho RusynCelticCentral AmericanCentral American IndianCherokeeCheyenneChickasawChileanChineseChippewaChoctawColombianColvilleComancheCosta RicanCreeCreekCroatianCrowCypriotCzechCzechoslovakianDanishDelawareDominicanDutchDutch West IndianEastern EuropeanEcuadorianEgyptianEnglishEstonianEthiopianEuropeanFijianFilipinoFinnishFrenchFrench American IndianFrench CanadianGermanGerman RussianGhanaianGreekGuamanian/ChamorroGuatemalanGuyaneseHaitianHmongHonduranHopiHoumaHungarianIcelanderIndian (Asian)IndonesianInupiatIranianIraqiIrishIroquoisIsraeliItalianJamaicanJapaneseJordanianKenyanKiowaKoreanLaotianLatvianLebaneseLiberianLithuanianLumbeeLuxembourgerMacedonianMalaysianMalteseMarshalleseMenomineeMexicanMexican American IndianMongolianMoroccanNative HawaiianNavajoNepaleseNew ZealanderNicaraguanNigerianNorthern EuropeanNorwegianOkinawanOsageOttawaPaiutePakistaniPalestinianPanamanianParaguayanPennsylvania GermanPeruvianPimaPolishPortuguesePotawatomiPuebloPuerto RicanPuget Sound SalishRomanianRussianSalvadoranSamoanScandinavianScotch-IrishScottishSeminoleSenegaleseSerbianShoshoneSierra LeoneanSiouxSlavicSlovakSloveneSomaliSouth AfricanSouth AmericanSouth American IndianSoviet UnionSpaniardSpanishSpanish AmericanSpanish American IndianSri LankanSubsaharan AfricanSudaneseSwedishSwissSyrianTaiwaneseThaiTlingit-HaidaTohono O'OdhamTonganTrinidadian and TobagonianTsimshianTurkishU.S. Virgin IslanderUgandanUkrainianUruguayanUteVenezuelanVietnameseWelshWest IndianYakamaYaquiYugoslavianYumanYup'ikZimbabwean
Immigration
NonimmigrantsImmigrantsAfghanistanAfricaAlbaniaArgentinaArmeniaAsiaAustraliaAustriaBahamasBangladeshBarbadosBelarusBelgiumBelizeBoliviaBosnia and HerzegovinaBrazilBulgariaBurma/MyanmarCabo VerdeCambodiaCameroonCanadaCaribbeanCentral AmericaChileChinaColombiaCongoCosta RicaCroatiaCubaCzechoslovakiaDenmarkDominicaDominican RepublicEastern AfricaEastern AsiaEastern EuropeEcuadorEgyptEl SalvadorEnglandEritreaEthiopiaEuropeFijiFranceGermanyGhanaGreeceGrenadaGuatemalaGuyanaHaitiHondurasHong KongHungaryIndiaIndonesiaIranIraqIrelandIsraelItalyJamaicaJapanJordanKazakhstanKenyaKoreaKuwaitLaosLatin AmericaLatviaLebanonLiberiaLithuaniaMalaysiaMexicoMicronesiaMiddle AfricaMoldovaMoroccoNepalNetherlandsNicaraguaNigeriaNorth AmericaNorth MacedoniaNorthern AfricaNorthern EuropeNorwayOceaniaPakistanPanamaPeruPhilippinesPolandPortugalRomaniaRussiaSaudi ArabiaScotlandSenegalSerbiaSierra LeoneSingaporeSomaliaSouth AfricaSouth AmericaSouth Central AsiaSouth Eastern AsiaSouthern EuropeSpainSri LankaSt. Vincent and the GrenadinesSudanSwedenSwitzerlandSyriaTaiwanThailandTrinidad and TobagoTurkeyUgandaUkraineUruguayUzbekistanVenezuelaVietnamWest IndiesWestern AfricaWestern AsiaWestern EuropeYemenZaireZimbabweAzores
Male Disability
Income
Poverty
Unemployment
Labor Participation
Family Structure
Vehicle Availability
Education Level
Disability

Male Disability Comparison

Cubans

Immigrants from South Central Asia

Good
Exceptional
11.0%
MALE DISABILITY
74.9/ 100
METRIC RATING
151st/ 347
METRIC RANK
9.4%
MALE DISABILITY
100.0/ 100
METRIC RATING
6th/ 347
METRIC RANK

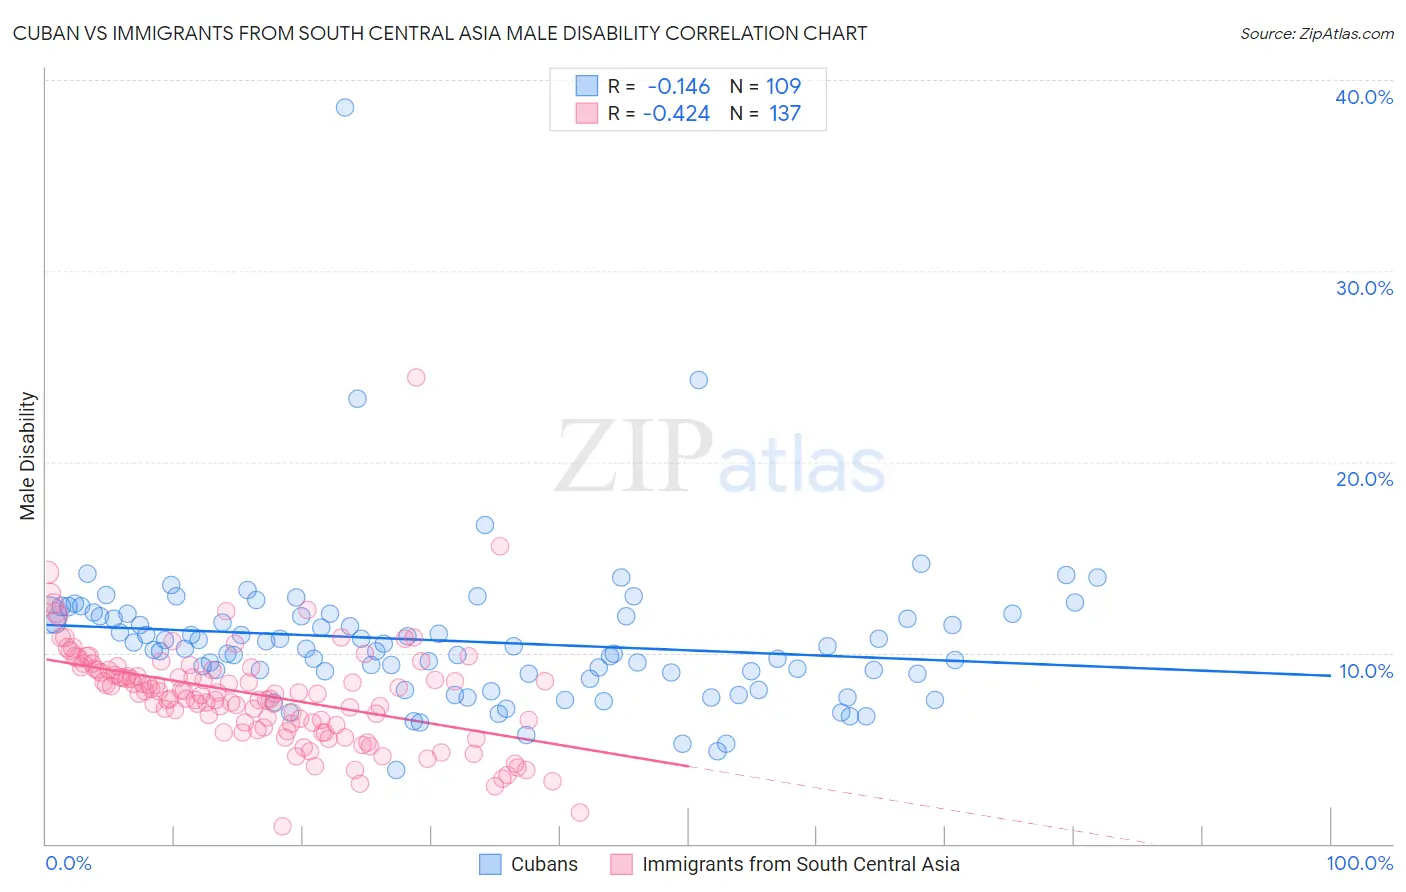
Cuban vs Immigrants from South Central Asia Male Disability Correlation Chart

The statistical analysis conducted on geographies consisting of 449,227,297 people shows a poor negative correlation between the proportion of Cubans and percentage of males with a disability in the United States with a correlation coefficient (R) of -0.146 and weighted average of 11.0%. Similarly, the statistical analysis conducted on geographies consisting of 473,016,937 people shows a moderate negative correlation between the proportion of Immigrants from South Central Asia and percentage of males with a disability in the United States with a correlation coefficient (R) of -0.424 and weighted average of 9.4%, a difference of 17.2%.
Cuban vs Immigrants from South Central Asia Male Disability

Male Disability Correlation Summary

MeasurementCubanImmigrants from South Central Asia
Minimum3.9%0.93%
Maximum38.6%24.4%
Range34.7%23.5%
Mean10.6%7.8%
Median10.2%7.9%
Interquartile 25% (IQ1)8.9%6.2%
Interquartile 75% (IQ3)11.9%9.1%
Interquartile Range (IQR)3.0%2.9%
Standard Deviation (Sample)4.0%2.8%
Standard Deviation (Population)4.0%2.8%

Similar Demographics by Male Disability

Demographics Similar to Cubans by Male Disability

In terms of male disability, the demographic groups most similar to Cubans are Immigrants from Guatemala (11.0%, a difference of 0.020%), Immigrants from Albania (11.0%, a difference of 0.030%), Immigrants from Denmark (11.0%, a difference of 0.12%), Immigrants from Northern Europe (11.1%, a difference of 0.12%), and Immigrants from Moldova (11.1%, a difference of 0.15%).
DemographicsRating | RankMale Disability
Kenyans
78.1
/100
|
#144
Good
11.0%
Costa Ricans
78.0
/100
|
#145
Good
11.0%
Koreans
77.5
/100
|
#146
Good
11.0%
Immigrants | Croatia
77.3
/100
|
#147
Good
11.0%
Sudanese
77.1
/100
|
#148
Good
11.0%
Immigrants | Denmark
76.4
/100
|
#149
Good
11.0%
Immigrants | Guatemala
75.1
/100
|
#150
Good
11.0%
Cubans
74.9
/100
|
#151
Good
11.0%
Immigrants | Albania
74.4
/100
|
#152
Good
11.0%
Immigrants | Northern Europe
73.2
/100
|
#153
Good
11.1%
Immigrants | Moldova
72.8
/100
|
#154
Good
11.1%
Immigrants | Middle Africa
70.9
/100
|
#155
Good
11.1%
Russians
69.8
/100
|
#156
Good
11.1%
Immigrants | Western Africa
69.2
/100
|
#157
Good
11.1%
Latvians
68.1
/100
|
#158
Good
11.1%

Demographics Similar to Immigrants from South Central Asia by Male Disability

In terms of male disability, the demographic groups most similar to Immigrants from South Central Asia are Immigrants from Hong Kong (9.4%, a difference of 0.060%), Immigrants from Bolivia (9.5%, a difference of 0.33%), Immigrants from China (9.5%, a difference of 0.93%), Immigrants from Singapore (9.5%, a difference of 1.0%), and Immigrants from Israel (9.6%, a difference of 1.4%).
DemographicsRating | RankMale Disability
Immigrants | India
100.0
/100
|
#1
Exceptional
9.0%
Immigrants | Taiwan
100.0
/100
|
#2
Exceptional
9.1%
Filipinos
100.0
/100
|
#3
Exceptional
9.1%
Thais
100.0
/100
|
#4
Exceptional
9.2%
Immigrants | Hong Kong
100.0
/100
|
#5
Exceptional
9.4%
Immigrants | South Central Asia
100.0
/100
|
#6
Exceptional
9.4%
Immigrants | Bolivia
100.0
/100
|
#7
Exceptional
9.5%
Immigrants | China
100.0
/100
|
#8
Exceptional
9.5%
Immigrants | Singapore
100.0
/100
|
#9
Exceptional
9.5%
Immigrants | Israel
100.0
/100
|
#10
Exceptional
9.6%
Immigrants | Eastern Asia
100.0
/100
|
#11
Exceptional
9.6%
Bolivians
100.0
/100
|
#12
Exceptional
9.6%
Iranians
100.0
/100
|
#13
Exceptional
9.7%
Immigrants | Iran
100.0
/100
|
#14
Exceptional
9.7%
Indians (Asian)
100.0
/100
|
#15
Exceptional
9.7%