Immigrants from Western Europe vs Immigrants from Syria Disability Age Over 75

COMPARE

Immigrants from Western Europe
Race
Ancestry
AfghanAfricanAlaska NativeAlaskan AthabascanAlbanianAleutAlsatianAmericanApacheArabArapahoArgentineanArmenianAssyrian/Chaldean/SyriacAustralianAustrianBahamianBangladeshiBarbadianBasqueBelgianBelizeanBermudanBhutaneseBlackfeetBolivianBrazilianBritishBritish West IndianBulgarianBurmeseCajunCambodianCanadianCape VerdeanCarpatho RusynCelticCentral AmericanCentral American IndianCherokeeCheyenneChickasawChileanChineseChippewaChoctawColombianColvilleComancheCosta RicanCreeCreekCroatianCrowCubanCypriotCzechCzechoslovakianDanishDelawareDominicanDutchDutch West IndianEastern EuropeanEcuadorianEgyptianEnglishEstonianEthiopianEuropeanFijianFilipinoFinnishFrenchFrench American IndianFrench CanadianGermanGerman RussianGhanaianGreekGuamanian/ChamorroGuatemalanGuyaneseHaitianHmongHonduranHopiHoumaHungarianIcelanderIndian (Asian)IndonesianInupiatIranianIraqiIrishIroquoisIsraeliItalianJamaicanJapaneseJordanianKenyanKiowaKoreanLaotianLatvianLebaneseLiberianLithuanianLumbeeLuxembourgerMacedonianMalaysianMalteseMarshalleseMenomineeMexicanMexican American IndianMongolianMoroccanNative HawaiianNavajoNepaleseNew ZealanderNicaraguanNigerianNorthern EuropeanNorwegianOkinawanOsageOttawaPaiutePakistaniPalestinianPanamanianParaguayanPennsylvania GermanPeruvianPimaPolishPortuguesePotawatomiPuebloPuerto RicanPuget Sound SalishRomanianRussianSalvadoranSamoanScandinavianScotch-IrishScottishSeminoleSenegaleseSerbianShoshoneSierra LeoneanSiouxSlavicSlovakSloveneSomaliSouth AfricanSouth AmericanSouth American IndianSoviet UnionSpaniardSpanishSpanish AmericanSpanish American IndianSri LankanSubsaharan AfricanSudaneseSwedishSwissSyrianTaiwaneseThaiTlingit-HaidaTohono O'OdhamTonganTrinidadian and TobagonianTsimshianTurkishU.S. Virgin IslanderUgandanUkrainianUruguayanUteVenezuelanVietnameseWelshWest IndianYakamaYaquiYugoslavianYumanYup'ikZimbabwean
Immigration
NonimmigrantsImmigrantsAfghanistanAfricaAlbaniaArgentinaArmeniaAsiaAustraliaAustriaBahamasBangladeshBarbadosBelarusBelgiumBelizeBoliviaBosnia and HerzegovinaBrazilBulgariaBurma/MyanmarCabo VerdeCambodiaCameroonCanadaCaribbeanCentral AmericaChileChinaColombiaCongoCosta RicaCroatiaCubaCzechoslovakiaDenmarkDominicaDominican RepublicEastern AfricaEastern AsiaEastern EuropeEcuadorEgyptEl SalvadorEnglandEritreaEthiopiaEuropeFijiFranceGermanyGhanaGreeceGrenadaGuatemalaGuyanaHaitiHondurasHong KongHungaryIndiaIndonesiaIranIraqIrelandIsraelItalyJamaicaJapanJordanKazakhstanKenyaKoreaKuwaitLaosLatin AmericaLatviaLebanonLiberiaLithuaniaMalaysiaMexicoMicronesiaMiddle AfricaMoldovaMoroccoNepalNetherlandsNicaraguaNigeriaNorth AmericaNorth MacedoniaNorthern AfricaNorthern EuropeNorwayOceaniaPakistanPanamaPeruPhilippinesPolandPortugalRomaniaRussiaSaudi ArabiaScotlandSenegalSerbiaSierra LeoneSingaporeSomaliaSouth AfricaSouth AmericaSouth Central AsiaSouth Eastern AsiaSouthern EuropeSpainSri LankaSt. Vincent and the GrenadinesSudanSwedenSwitzerlandTaiwanThailandTrinidad and TobagoTurkeyUgandaUkraineUruguayUzbekistanVenezuelaVietnamWest IndiesWestern AfricaWestern AsiaWestern EuropeYemenZaireZimbabweAzores
Immigrants from Syria
Race
Ancestry
AfghanAfricanAlaska NativeAlaskan AthabascanAlbanianAleutAlsatianAmericanApacheArabArapahoArgentineanArmenianAssyrian/Chaldean/SyriacAustralianAustrianBahamianBangladeshiBarbadianBasqueBelgianBelizeanBermudanBhutaneseBlackfeetBolivianBrazilianBritishBritish West IndianBulgarianBurmeseCajunCambodianCanadianCape VerdeanCarpatho RusynCelticCentral AmericanCentral American IndianCherokeeCheyenneChickasawChileanChineseChippewaChoctawColombianColvilleComancheCosta RicanCreeCreekCroatianCrowCubanCypriotCzechCzechoslovakianDanishDelawareDominicanDutchDutch West IndianEastern EuropeanEcuadorianEgyptianEnglishEstonianEthiopianEuropeanFijianFilipinoFinnishFrenchFrench American IndianFrench CanadianGermanGerman RussianGhanaianGreekGuamanian/ChamorroGuatemalanGuyaneseHaitianHmongHonduranHopiHoumaHungarianIcelanderIndian (Asian)IndonesianInupiatIranianIraqiIrishIroquoisIsraeliItalianJamaicanJapaneseJordanianKenyanKiowaKoreanLaotianLatvianLebaneseLiberianLithuanianLumbeeLuxembourgerMacedonianMalaysianMalteseMarshalleseMenomineeMexicanMexican American IndianMongolianMoroccanNative HawaiianNavajoNepaleseNew ZealanderNicaraguanNigerianNorthern EuropeanNorwegianOkinawanOsageOttawaPaiutePakistaniPalestinianPanamanianParaguayanPennsylvania GermanPeruvianPimaPolishPortuguesePotawatomiPuebloPuerto RicanPuget Sound SalishRomanianRussianSalvadoranSamoanScandinavianScotch-IrishScottishSeminoleSenegaleseSerbianShoshoneSierra LeoneanSiouxSlavicSlovakSloveneSomaliSouth AfricanSouth AmericanSouth American IndianSoviet UnionSpaniardSpanishSpanish AmericanSpanish American IndianSri LankanSubsaharan AfricanSudaneseSwedishSwissSyrianTaiwaneseThaiTlingit-HaidaTohono O'OdhamTonganTrinidadian and TobagonianTsimshianTurkishU.S. Virgin IslanderUgandanUkrainianUruguayanUteVenezuelanVietnameseWelshWest IndianYakamaYaquiYugoslavianYumanYup'ikZimbabwean
Immigration
NonimmigrantsImmigrantsAfghanistanAfricaAlbaniaArgentinaArmeniaAsiaAustraliaAustriaBahamasBangladeshBarbadosBelarusBelgiumBelizeBoliviaBosnia and HerzegovinaBrazilBulgariaBurma/MyanmarCabo VerdeCambodiaCameroonCanadaCaribbeanCentral AmericaChileChinaColombiaCongoCosta RicaCroatiaCubaCzechoslovakiaDenmarkDominicaDominican RepublicEastern AfricaEastern AsiaEastern EuropeEcuadorEgyptEl SalvadorEnglandEritreaEthiopiaEuropeFijiFranceGermanyGhanaGreeceGrenadaGuatemalaGuyanaHaitiHondurasHong KongHungaryIndiaIndonesiaIranIraqIrelandIsraelItalyJamaicaJapanJordanKazakhstanKenyaKoreaKuwaitLaosLatin AmericaLatviaLebanonLiberiaLithuaniaMalaysiaMexicoMicronesiaMiddle AfricaMoldovaMoroccoNepalNetherlandsNicaraguaNigeriaNorth AmericaNorth MacedoniaNorthern AfricaNorthern EuropeNorwayOceaniaPakistanPanamaPeruPhilippinesPolandPortugalRomaniaRussiaSaudi ArabiaScotlandSenegalSerbiaSierra LeoneSingaporeSomaliaSouth AfricaSouth AmericaSouth Central AsiaSouth Eastern AsiaSouthern EuropeSpainSri LankaSt. Vincent and the GrenadinesSudanSwedenSwitzerlandSyriaTaiwanThailandTrinidad and TobagoTurkeyUgandaUkraineUruguayUzbekistanVenezuelaVietnamWest IndiesWestern AfricaWestern AsiaYemenZaireZimbabweAzores
Disability Age Over 75
Income
Poverty
Unemployment
Labor Participation
Family Structure
Vehicle Availability
Education Level
Disability

Disability Age Over 75 Comparison

Immigrants from Western Europe

Immigrants from Syria

Exceptional
Poor
46.2%
DISABILITY AGE OVER 75
98.8/ 100
METRIC RATING
78th/ 347
METRIC RANK
47.8%
DISABILITY AGE OVER 75
17.4/ 100
METRIC RATING
207th/ 347
METRIC RANK

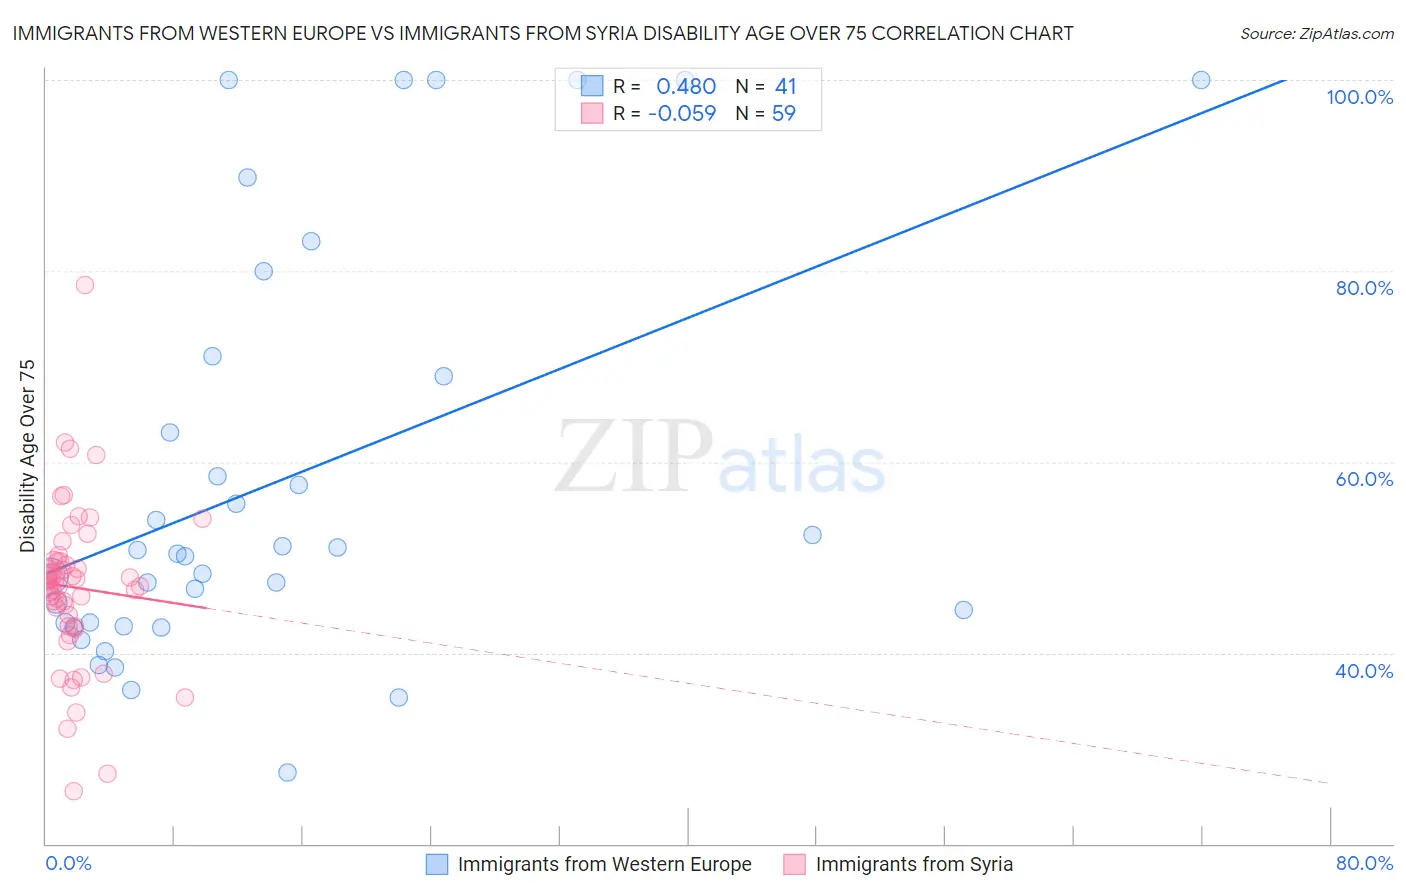
Immigrants from Western Europe vs Immigrants from Syria Disability Age Over 75 Correlation Chart

The statistical analysis conducted on geographies consisting of 493,053,123 people shows a moderate positive correlation between the proportion of Immigrants from Western Europe and percentage of population with a disability over the age of 75 in the United States with a correlation coefficient (R) of 0.480 and weighted average of 46.2%. Similarly, the statistical analysis conducted on geographies consisting of 174,043,785 people shows a slight negative correlation between the proportion of Immigrants from Syria and percentage of population with a disability over the age of 75 in the United States with a correlation coefficient (R) of -0.059 and weighted average of 47.8%, a difference of 3.5%.
Immigrants from Western Europe vs Immigrants from Syria Disability Age Over 75

Disability Age Over 75 Correlation Summary

MeasurementImmigrants from Western EuropeImmigrants from Syria
Minimum27.5%25.4%
Maximum100.0%78.6%
Range72.5%53.1%
Mean58.2%46.8%
Median50.4%47.5%
Interquartile 25% (IQ1)42.9%42.8%
Interquartile 75% (IQ3)70.0%49.6%
Interquartile Range (IQR)27.1%6.8%
Standard Deviation (Sample)21.6%8.4%
Standard Deviation (Population)21.3%8.3%

Similar Demographics by Disability Age Over 75

Demographics Similar to Immigrants from Western Europe by Disability Age Over 75

In terms of disability age over 75, the demographic groups most similar to Immigrants from Western Europe are Immigrants from Eastern Asia (46.2%, a difference of 0.010%), Swiss (46.2%, a difference of 0.040%), Soviet Union (46.2%, a difference of 0.040%), Slavic (46.1%, a difference of 0.050%), and New Zealander (46.2%, a difference of 0.050%).
DemographicsRating | RankDisability Age Over 75
Immigrants | Sri Lanka
99.2
/100
|
#71
Exceptional
46.1%
Immigrants | Hungary
99.1
/100
|
#72
Exceptional
46.1%
Cambodians
99.1
/100
|
#73
Exceptional
46.1%
Egyptians
99.0
/100
|
#74
Exceptional
46.1%
Serbians
99.0
/100
|
#75
Exceptional
46.1%
Slavs
98.9
/100
|
#76
Exceptional
46.1%
Immigrants | Eastern Asia
98.9
/100
|
#77
Exceptional
46.2%
Immigrants | Western Europe
98.8
/100
|
#78
Exceptional
46.2%
Swiss
98.8
/100
|
#79
Exceptional
46.2%
Soviet Union
98.8
/100
|
#80
Exceptional
46.2%
New Zealanders
98.8
/100
|
#81
Exceptional
46.2%
Immigrants | Latvia
98.7
/100
|
#82
Exceptional
46.2%
Argentineans
98.7
/100
|
#83
Exceptional
46.2%
Immigrants | Jordan
98.7
/100
|
#84
Exceptional
46.2%
Immigrants | Southern Europe
98.6
/100
|
#85
Exceptional
46.2%

Demographics Similar to Immigrants from Syria by Disability Age Over 75

In terms of disability age over 75, the demographic groups most similar to Immigrants from Syria are Immigrants from Senegal (47.8%, a difference of 0.020%), Immigrants from Ghana (47.7%, a difference of 0.060%), Jamaican (47.7%, a difference of 0.060%), Nigerian (47.7%, a difference of 0.070%), and Trinidadian and Tobagonian (47.7%, a difference of 0.10%).
DemographicsRating | RankDisability Age Over 75
Immigrants | Somalia
21.4
/100
|
#200
Fair
47.7%
Immigrants | Cuba
20.9
/100
|
#201
Fair
47.7%
Immigrants | Bahamas
20.7
/100
|
#202
Fair
47.7%
Trinidadians and Tobagonians
20.0
/100
|
#203
Fair
47.7%
Nigerians
19.2
/100
|
#204
Poor
47.7%
Immigrants | Ghana
19.1
/100
|
#205
Poor
47.7%
Jamaicans
19.0
/100
|
#206
Poor
47.7%
Immigrants | Syria
17.4
/100
|
#207
Poor
47.8%
Immigrants | Senegal
16.9
/100
|
#208
Poor
47.8%
Immigrants | Indonesia
14.2
/100
|
#209
Poor
47.8%
Vietnamese
11.9
/100
|
#210
Poor
47.9%
Panamanians
11.8
/100
|
#211
Poor
47.9%
Immigrants | Burma/Myanmar
11.7
/100
|
#212
Poor
47.9%
Laotians
11.5
/100
|
#213
Poor
47.9%
Immigrants | Barbados
10.7
/100
|
#214
Poor
47.9%