Immigrants from Turkey vs Hmong Male Disability

COMPARE

Immigrants from Turkey
Race
Ancestry
AfghanAfricanAlaska NativeAlaskan AthabascanAlbanianAleutAlsatianAmericanApacheArabArapahoArgentineanArmenianAssyrian/Chaldean/SyriacAustralianAustrianBahamianBangladeshiBarbadianBasqueBelgianBelizeanBermudanBhutaneseBlackfeetBolivianBrazilianBritishBritish West IndianBulgarianBurmeseCajunCambodianCanadianCape VerdeanCarpatho RusynCelticCentral AmericanCentral American IndianCherokeeCheyenneChickasawChileanChineseChippewaChoctawColombianColvilleComancheCosta RicanCreeCreekCroatianCrowCubanCypriotCzechCzechoslovakianDanishDelawareDominicanDutchDutch West IndianEastern EuropeanEcuadorianEgyptianEnglishEstonianEthiopianEuropeanFijianFilipinoFinnishFrenchFrench American IndianFrench CanadianGermanGerman RussianGhanaianGreekGuamanian/ChamorroGuatemalanGuyaneseHaitianHonduranHopiHoumaHungarianIcelanderIndian (Asian)IndonesianInupiatIranianIraqiIrishIroquoisIsraeliItalianJamaicanJapaneseJordanianKenyanKiowaKoreanLaotianLatvianLebaneseLiberianLithuanianLumbeeLuxembourgerMacedonianMalaysianMalteseMarshalleseMenomineeMexicanMexican American IndianMongolianMoroccanNative HawaiianNavajoNepaleseNew ZealanderNicaraguanNigerianNorthern EuropeanNorwegianOkinawanOsageOttawaPaiutePakistaniPalestinianPanamanianParaguayanPennsylvania GermanPeruvianPimaPolishPortuguesePotawatomiPuebloPuerto RicanPuget Sound SalishRomanianRussianSalvadoranSamoanScandinavianScotch-IrishScottishSeminoleSenegaleseSerbianShoshoneSierra LeoneanSiouxSlavicSlovakSloveneSomaliSouth AfricanSouth AmericanSouth American IndianSoviet UnionSpaniardSpanishSpanish AmericanSpanish American IndianSri LankanSubsaharan AfricanSudaneseSwedishSwissSyrianTaiwaneseThaiTlingit-HaidaTohono O'OdhamTonganTrinidadian and TobagonianTsimshianTurkishU.S. Virgin IslanderUgandanUkrainianUruguayanUteVenezuelanVietnameseWelshWest IndianYakamaYaquiYugoslavianYumanYup'ikZimbabwean
Immigration
NonimmigrantsImmigrantsAfghanistanAfricaAlbaniaArgentinaArmeniaAsiaAustraliaAustriaBahamasBangladeshBarbadosBelarusBelgiumBelizeBoliviaBosnia and HerzegovinaBrazilBulgariaBurma/MyanmarCabo VerdeCambodiaCameroonCanadaCaribbeanCentral AmericaChileChinaColombiaCongoCosta RicaCroatiaCubaCzechoslovakiaDenmarkDominicaDominican RepublicEastern AfricaEastern AsiaEastern EuropeEcuadorEgyptEl SalvadorEnglandEritreaEthiopiaEuropeFijiFranceGermanyGhanaGreeceGrenadaGuatemalaGuyanaHaitiHondurasHong KongHungaryIndiaIndonesiaIranIraqIrelandIsraelItalyJamaicaJapanJordanKazakhstanKenyaKoreaKuwaitLaosLatin AmericaLatviaLebanonLiberiaLithuaniaMalaysiaMexicoMicronesiaMiddle AfricaMoldovaMoroccoNepalNetherlandsNicaraguaNigeriaNorth AmericaNorth MacedoniaNorthern AfricaNorthern EuropeNorwayOceaniaPakistanPanamaPeruPhilippinesPolandPortugalRomaniaRussiaSaudi ArabiaScotlandSenegalSerbiaSierra LeoneSingaporeSomaliaSouth AfricaSouth AmericaSouth Central AsiaSouth Eastern AsiaSouthern EuropeSpainSri LankaSt. Vincent and the GrenadinesSudanSwedenSwitzerlandSyriaTaiwanThailandTrinidad and TobagoTurkeyUgandaUkraineUruguayUzbekistanVenezuelaVietnamWest IndiesWestern AfricaWestern AsiaWestern EuropeYemenZaireZimbabweAzores
Hmong
Race
Ancestry
AfghanAfricanAlaska NativeAlaskan AthabascanAlbanianAleutAlsatianAmericanApacheArabArapahoArgentineanArmenianAssyrian/Chaldean/SyriacAustralianAustrianBahamianBangladeshiBarbadianBasqueBelgianBelizeanBermudanBhutaneseBlackfeetBolivianBrazilianBritishBritish West IndianBulgarianBurmeseCajunCambodianCanadianCape VerdeanCarpatho RusynCelticCentral AmericanCentral American IndianCherokeeCheyenneChickasawChileanChineseChippewaChoctawColombianColvilleComancheCosta RicanCreeCreekCroatianCrowCubanCypriotCzechCzechoslovakianDanishDelawareDominicanDutchDutch West IndianEastern EuropeanEcuadorianEgyptianEnglishEstonianEthiopianEuropeanFijianFilipinoFinnishFrenchFrench American IndianFrench CanadianGermanGerman RussianGhanaianGreekGuamanian/ChamorroGuatemalanGuyaneseHaitianHmongHonduranHopiHoumaHungarianIcelanderIndian (Asian)IndonesianInupiatIranianIraqiIrishIroquoisIsraeliItalianJamaicanJapaneseJordanianKenyanKiowaKoreanLaotianLatvianLebaneseLiberianLithuanianLumbeeLuxembourgerMacedonianMalaysianMalteseMarshalleseMenomineeMexicanMexican American IndianMongolianMoroccanNative HawaiianNavajoNepaleseNew ZealanderNicaraguanNigerianNorthern EuropeanNorwegianOkinawanOsageOttawaPaiutePakistaniPalestinianPanamanianParaguayanPennsylvania GermanPeruvianPimaPolishPortuguesePotawatomiPuebloPuerto RicanPuget Sound SalishRomanianRussianSalvadoranSamoanScandinavianScotch-IrishScottishSeminoleSenegaleseSerbianShoshoneSierra LeoneanSiouxSlavicSlovakSloveneSomaliSouth AfricanSouth AmericanSouth American IndianSoviet UnionSpaniardSpanishSpanish AmericanSpanish American IndianSri LankanSubsaharan AfricanSudaneseSwedishSwissSyrianTaiwaneseThaiTlingit-HaidaTohono O'OdhamTonganTrinidadian and TobagonianTsimshianTurkishU.S. Virgin IslanderUgandanUkrainianUruguayanUteVenezuelanVietnameseWelshWest IndianYakamaYaquiYugoslavianYumanYup'ikZimbabwean
Immigration
NonimmigrantsImmigrantsAfghanistanAfricaAlbaniaArgentinaArmeniaAsiaAustraliaAustriaBahamasBangladeshBarbadosBelarusBelgiumBelizeBoliviaBosnia and HerzegovinaBrazilBulgariaBurma/MyanmarCabo VerdeCambodiaCameroonCanadaCaribbeanCentral AmericaChileChinaColombiaCongoCosta RicaCroatiaCubaCzechoslovakiaDenmarkDominicaDominican RepublicEastern AfricaEastern AsiaEastern EuropeEcuadorEgyptEl SalvadorEnglandEritreaEthiopiaEuropeFijiFranceGermanyGhanaGreeceGrenadaGuatemalaGuyanaHaitiHondurasHong KongHungaryIndiaIndonesiaIranIraqIrelandIsraelItalyJamaicaJapanJordanKazakhstanKenyaKoreaKuwaitLaosLatin AmericaLatviaLebanonLiberiaLithuaniaMalaysiaMexicoMicronesiaMiddle AfricaMoldovaMoroccoNepalNetherlandsNicaraguaNigeriaNorth AmericaNorth MacedoniaNorthern AfricaNorthern EuropeNorwayOceaniaPakistanPanamaPeruPhilippinesPolandPortugalRomaniaRussiaSaudi ArabiaScotlandSenegalSerbiaSierra LeoneSingaporeSomaliaSouth AfricaSouth AmericaSouth Central AsiaSouth Eastern AsiaSouthern EuropeSpainSri LankaSt. Vincent and the GrenadinesSudanSwedenSwitzerlandSyriaTaiwanThailandTrinidad and TobagoUgandaUkraineUruguayUzbekistanVenezuelaVietnamWest IndiesWestern AfricaWestern AsiaWestern EuropeYemenZaireZimbabweAzores
Male Disability
Income
Poverty
Unemployment
Labor Participation
Family Structure
Vehicle Availability
Education Level
Disability

Male Disability Comparison

Immigrants from Turkey

Hmong

Exceptional
Tragic
10.2%
MALE DISABILITY
99.9/ 100
METRIC RATING
34th/ 347
METRIC RANK
12.5%
MALE DISABILITY
0.0/ 100
METRIC RATING
272nd/ 347
METRIC RANK

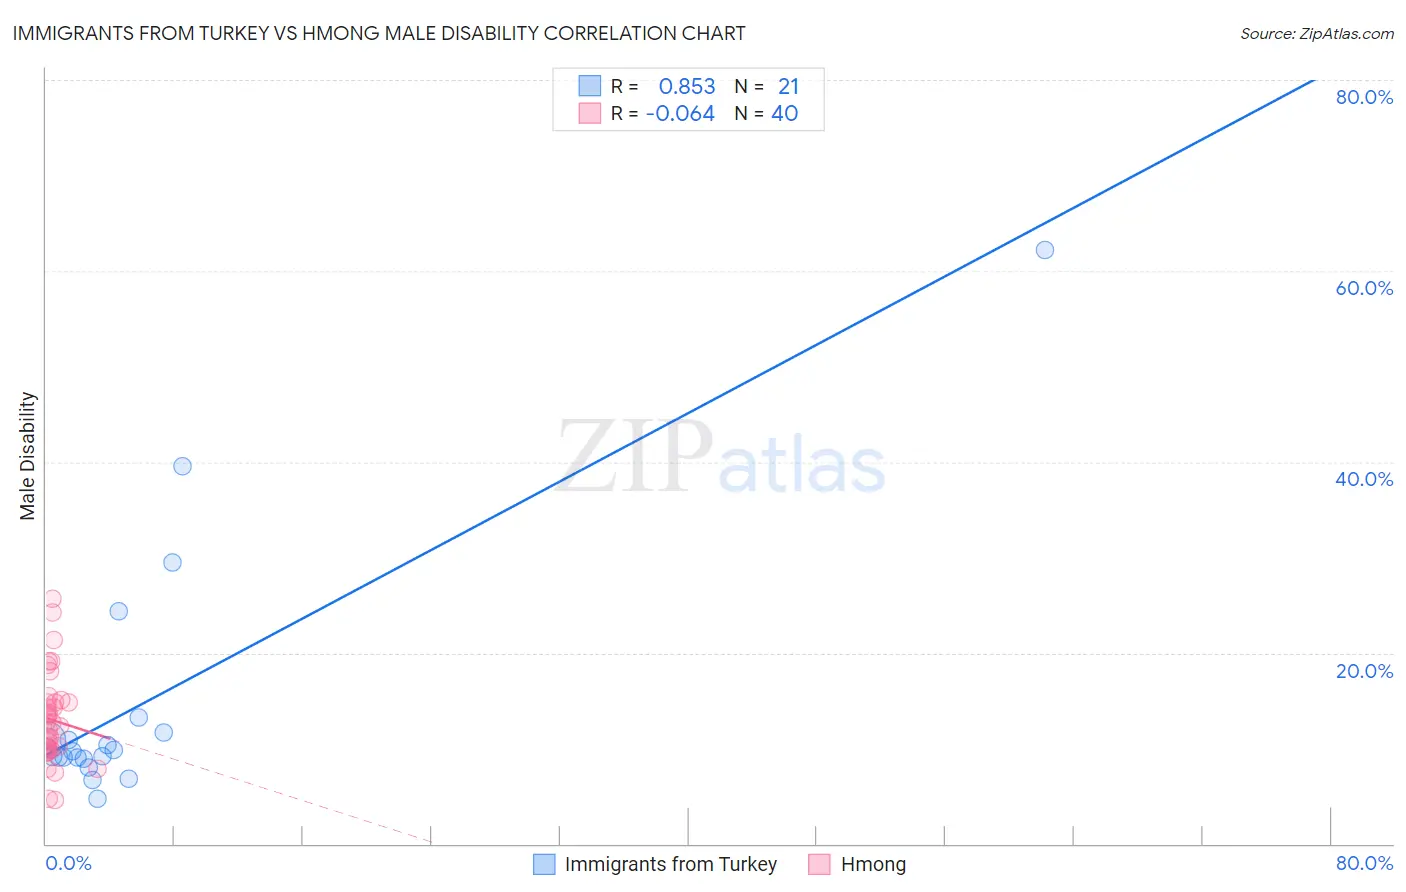
Immigrants from Turkey vs Hmong Male Disability Correlation Chart

The statistical analysis conducted on geographies consisting of 223,048,853 people shows a very strong positive correlation between the proportion of Immigrants from Turkey and percentage of males with a disability in the United States with a correlation coefficient (R) of 0.853 and weighted average of 10.2%. Similarly, the statistical analysis conducted on geographies consisting of 24,681,537 people shows a slight negative correlation between the proportion of Hmong and percentage of males with a disability in the United States with a correlation coefficient (R) of -0.064 and weighted average of 12.5%, a difference of 22.4%.
Immigrants from Turkey vs Hmong Male Disability

Male Disability Correlation Summary

MeasurementImmigrants from TurkeyHmong
Minimum4.8%4.6%
Maximum62.2%25.6%
Range57.4%21.1%
Mean14.9%13.0%
Median9.7%12.5%
Interquartile 25% (IQ1)9.0%10.0%
Interquartile 75% (IQ3)12.5%14.8%
Interquartile Range (IQR)3.5%4.8%
Standard Deviation (Sample)13.7%4.7%
Standard Deviation (Population)13.4%4.6%

Similar Demographics by Male Disability

Demographics Similar to Immigrants from Turkey by Male Disability

In terms of male disability, the demographic groups most similar to Immigrants from Turkey are Immigrants from Ethiopia (10.2%, a difference of 0.060%), Immigrants from Argentina (10.2%, a difference of 0.11%), Ethiopian (10.2%, a difference of 0.16%), Immigrants from Indonesia (10.2%, a difference of 0.24%), and Immigrants from Kuwait (10.2%, a difference of 0.41%).
DemographicsRating | RankMale Disability
Egyptians
99.9
/100
|
#27
Exceptional
10.1%
Vietnamese
99.9
/100
|
#28
Exceptional
10.1%
Venezuelans
99.9
/100
|
#29
Exceptional
10.1%
Immigrants | Egypt
99.9
/100
|
#30
Exceptional
10.1%
Soviet Union
99.9
/100
|
#31
Exceptional
10.1%
Argentineans
99.9
/100
|
#32
Exceptional
10.1%
Immigrants | Ethiopia
99.9
/100
|
#33
Exceptional
10.2%
Immigrants | Turkey
99.9
/100
|
#34
Exceptional
10.2%
Immigrants | Argentina
99.9
/100
|
#35
Exceptional
10.2%
Ethiopians
99.8
/100
|
#36
Exceptional
10.2%
Immigrants | Indonesia
99.8
/100
|
#37
Exceptional
10.2%
Immigrants | Kuwait
99.8
/100
|
#38
Exceptional
10.2%
Afghans
99.8
/100
|
#39
Exceptional
10.2%
Immigrants | Nepal
99.8
/100
|
#40
Exceptional
10.3%
Taiwanese
99.8
/100
|
#41
Exceptional
10.3%

Demographics Similar to Hmong by Male Disability

In terms of male disability, the demographic groups most similar to Hmong are Native Hawaiian (12.5%, a difference of 0.060%), Hopi (12.5%, a difference of 0.39%), Fijian (12.6%, a difference of 0.75%), African (12.6%, a difference of 0.80%), and Finnish (12.6%, a difference of 1.1%).
DemographicsRating | RankMale Disability
Immigrants | Portugal
0.1
/100
|
#265
Tragic
12.3%
Hawaiians
0.1
/100
|
#266
Tragic
12.3%
Immigrants | Germany
0.1
/100
|
#267
Tragic
12.3%
Portuguese
0.1
/100
|
#268
Tragic
12.3%
Czechoslovakians
0.1
/100
|
#269
Tragic
12.3%
Spaniards
0.1
/100
|
#270
Tragic
12.3%
Scandinavians
0.1
/100
|
#271
Tragic
12.3%
Hmong
0.0
/100
|
#272
Tragic
12.5%
Native Hawaiians
0.0
/100
|
#273
Tragic
12.5%
Hopi
0.0
/100
|
#274
Tragic
12.5%
Fijians
0.0
/100
|
#275
Tragic
12.6%
Africans
0.0
/100
|
#276
Tragic
12.6%
Finns
0.0
/100
|
#277
Tragic
12.6%
Central American Indians
0.0
/100
|
#278
Tragic
12.7%
Slovaks
0.0
/100
|
#279
Tragic
12.7%