Immigrants from Southern Europe vs African Disability Age 65 to 74

COMPARE

Immigrants from Southern Europe
Race
Ancestry
AfghanAlaska NativeAlaskan AthabascanAlbanianAleutAlsatianAmericanApacheArabArapahoArgentineanArmenianAssyrian/Chaldean/SyriacAustralianAustrianBahamianBangladeshiBarbadianBasqueBelgianBelizeanBermudanBhutaneseBlackfeetBolivianBrazilianBritishBritish West IndianBulgarianBurmeseCajunCambodianCanadianCape VerdeanCarpatho RusynCelticCentral AmericanCentral American IndianCherokeeCheyenneChickasawChileanChineseChippewaChoctawColombianColvilleComancheCosta RicanCreeCreekCroatianCrowCubanCypriotCzechCzechoslovakianDanishDelawareDominicanDutchDutch West IndianEastern EuropeanEcuadorianEgyptianEnglishEstonianEthiopianEuropeanFijianFilipinoFinnishFrenchFrench American IndianFrench CanadianGermanGerman RussianGhanaianGreekGuamanian/ChamorroGuatemalanGuyaneseHaitianHmongHonduranHopiHoumaHungarianIcelanderIndian (Asian)IndonesianInupiatIranianIraqiIrishIroquoisIsraeliItalianJamaicanJapaneseJordanianKenyanKiowaKoreanLaotianLatvianLebaneseLiberianLithuanianLumbeeLuxembourgerMacedonianMalaysianMalteseMarshalleseMenomineeMexicanMexican American IndianMongolianMoroccanNative HawaiianNavajoNepaleseNew ZealanderNicaraguanNigerianNorthern EuropeanNorwegianOkinawanOsageOttawaPaiutePakistaniPalestinianPanamanianParaguayanPennsylvania GermanPeruvianPimaPolishPortuguesePotawatomiPuebloPuerto RicanPuget Sound SalishRomanianRussianSalvadoranSamoanScandinavianScotch-IrishScottishSeminoleSenegaleseSerbianShoshoneSierra LeoneanSiouxSlavicSlovakSloveneSomaliSouth AfricanSouth AmericanSouth American IndianSoviet UnionSpaniardSpanishSpanish AmericanSpanish American IndianSri LankanSubsaharan AfricanSudaneseSwedishSwissSyrianTaiwaneseThaiTlingit-HaidaTohono O'OdhamTonganTrinidadian and TobagonianTsimshianTurkishU.S. Virgin IslanderUgandanUkrainianUruguayanUteVenezuelanVietnameseWelshWest IndianYakamaYaquiYugoslavianYumanYup'ikZimbabwean
Immigration
NonimmigrantsImmigrantsAfghanistanAfricaAlbaniaArgentinaArmeniaAsiaAustraliaAustriaBahamasBangladeshBarbadosBelarusBelgiumBelizeBoliviaBosnia and HerzegovinaBrazilBulgariaBurma/MyanmarCabo VerdeCambodiaCameroonCanadaCaribbeanCentral AmericaChileChinaColombiaCongoCosta RicaCroatiaCubaCzechoslovakiaDenmarkDominicaDominican RepublicEastern AfricaEastern AsiaEastern EuropeEcuadorEgyptEl SalvadorEnglandEritreaEthiopiaEuropeFijiFranceGermanyGhanaGreeceGrenadaGuatemalaGuyanaHaitiHondurasHong KongHungaryIndiaIndonesiaIranIraqIrelandIsraelItalyJamaicaJapanJordanKazakhstanKenyaKoreaKuwaitLaosLatin AmericaLatviaLebanonLiberiaLithuaniaMalaysiaMexicoMicronesiaMiddle AfricaMoldovaMoroccoNepalNetherlandsNicaraguaNigeriaNorth AmericaNorth MacedoniaNorthern AfricaNorthern EuropeNorwayOceaniaPakistanPanamaPeruPhilippinesPolandPortugalRomaniaRussiaSaudi ArabiaScotlandSenegalSerbiaSierra LeoneSingaporeSomaliaSouth AfricaSouth AmericaSouth Central AsiaSouth Eastern AsiaSouthern EuropeSpainSri LankaSt. Vincent and the GrenadinesSudanSwedenSwitzerlandSyriaTaiwanThailandTrinidad and TobagoTurkeyUgandaUkraineUruguayUzbekistanVenezuelaVietnamWest IndiesWestern AfricaWestern AsiaWestern EuropeYemenZaireZimbabweAzores
African
Race
Ancestry
AfghanAfricanAlaska NativeAlaskan AthabascanAlbanianAleutAlsatianAmericanApacheArabArapahoArgentineanArmenianAssyrian/Chaldean/SyriacAustralianAustrianBahamianBangladeshiBarbadianBasqueBelgianBelizeanBermudanBhutaneseBlackfeetBolivianBrazilianBritishBritish West IndianBulgarianBurmeseCajunCambodianCanadianCape VerdeanCarpatho RusynCelticCentral AmericanCentral American IndianCherokeeCheyenneChickasawChileanChineseChippewaChoctawColombianColvilleComancheCosta RicanCreeCreekCroatianCrowCubanCypriotCzechCzechoslovakianDanishDelawareDominicanDutchDutch West IndianEastern EuropeanEcuadorianEgyptianEnglishEstonianEthiopianEuropeanFijianFilipinoFinnishFrenchFrench American IndianFrench CanadianGermanGerman RussianGhanaianGreekGuamanian/ChamorroGuatemalanGuyaneseHaitianHmongHonduranHopiHoumaHungarianIcelanderIndian (Asian)IndonesianInupiatIranianIraqiIrishIroquoisIsraeliItalianJamaicanJapaneseJordanianKenyanKiowaKoreanLaotianLatvianLebaneseLiberianLithuanianLumbeeLuxembourgerMacedonianMalaysianMalteseMarshalleseMenomineeMexicanMexican American IndianMongolianMoroccanNative HawaiianNavajoNepaleseNew ZealanderNicaraguanNigerianNorthern EuropeanNorwegianOkinawanOsageOttawaPaiutePakistaniPalestinianPanamanianParaguayanPennsylvania GermanPeruvianPimaPolishPortuguesePotawatomiPuebloPuerto RicanPuget Sound SalishRomanianRussianSalvadoranSamoanScandinavianScotch-IrishScottishSeminoleSenegaleseSerbianShoshoneSierra LeoneanSiouxSlavicSlovakSloveneSomaliSouth AfricanSouth AmericanSouth American IndianSoviet UnionSpaniardSpanishSpanish AmericanSpanish American IndianSri LankanSubsaharan AfricanSudaneseSwedishSwissSyrianTaiwaneseThaiTlingit-HaidaTohono O'OdhamTonganTrinidadian and TobagonianTsimshianTurkishU.S. Virgin IslanderUgandanUkrainianUruguayanUteVenezuelanVietnameseWelshWest IndianYakamaYaquiYugoslavianYumanYup'ikZimbabwean
Immigration
NonimmigrantsImmigrantsAfghanistanAfricaAlbaniaArgentinaArmeniaAsiaAustraliaAustriaBahamasBangladeshBarbadosBelarusBelgiumBelizeBoliviaBosnia and HerzegovinaBrazilBulgariaBurma/MyanmarCabo VerdeCambodiaCameroonCanadaCaribbeanCentral AmericaChileChinaColombiaCongoCosta RicaCroatiaCubaCzechoslovakiaDenmarkDominicaDominican RepublicEastern AfricaEastern AsiaEastern EuropeEcuadorEgyptEl SalvadorEnglandEritreaEthiopiaEuropeFijiFranceGermanyGhanaGreeceGrenadaGuatemalaGuyanaHaitiHondurasHong KongHungaryIndiaIndonesiaIranIraqIrelandIsraelItalyJamaicaJapanJordanKazakhstanKenyaKoreaKuwaitLaosLatin AmericaLatviaLebanonLiberiaLithuaniaMalaysiaMexicoMicronesiaMiddle AfricaMoldovaMoroccoNepalNetherlandsNicaraguaNigeriaNorth AmericaNorth MacedoniaNorthern AfricaNorthern EuropeNorwayOceaniaPakistanPanamaPeruPhilippinesPolandPortugalRomaniaRussiaSaudi ArabiaScotlandSenegalSerbiaSierra LeoneSingaporeSomaliaSouth AfricaSouth AmericaSouth Central AsiaSouth Eastern AsiaSpainSri LankaSt. Vincent and the GrenadinesSudanSwedenSwitzerlandSyriaTaiwanThailandTrinidad and TobagoTurkeyUgandaUkraineUruguayUzbekistanVenezuelaVietnamWest IndiesWestern AfricaWestern AsiaWestern EuropeYemenZaireZimbabweAzores
Disability Age 65 to 74
Income
Poverty
Unemployment
Labor Participation
Family Structure
Vehicle Availability
Education Level
Disability

Disability Age 65 to 74 Comparison

Immigrants from Southern Europe

Africans

Exceptional
Tragic
22.1%
DISABILITY AGE 65 TO 74
97.2/ 100
METRIC RATING
97th/ 347
METRIC RANK
26.2%
DISABILITY AGE 65 TO 74
0.0/ 100
METRIC RATING
289th/ 347
METRIC RANK

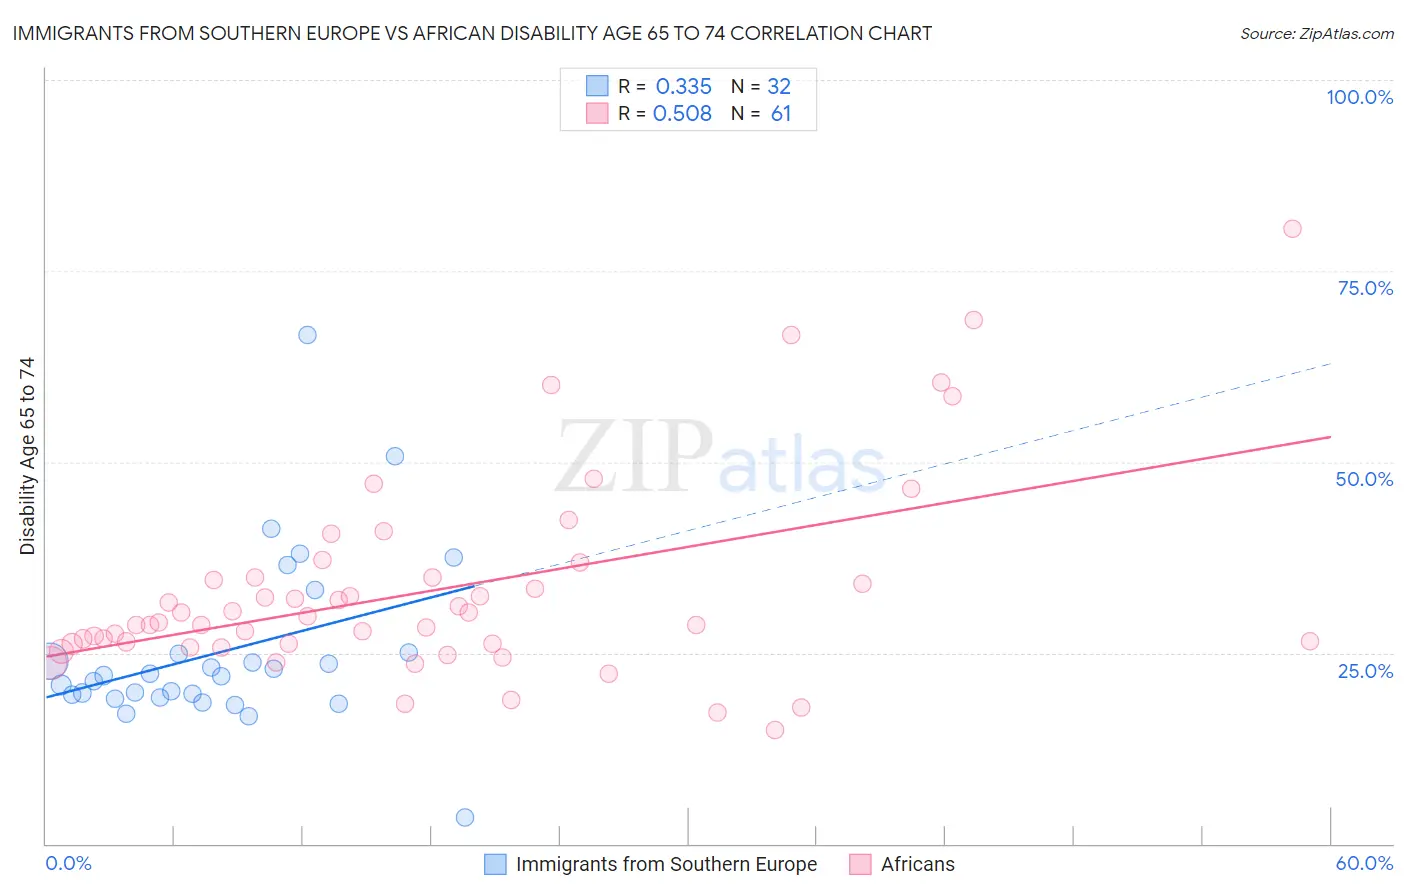
Immigrants from Southern Europe vs African Disability Age 65 to 74 Correlation Chart

The statistical analysis conducted on geographies consisting of 402,150,656 people shows a mild positive correlation between the proportion of Immigrants from Southern Europe and percentage of population with a disability between the ages 65 and 75 in the United States with a correlation coefficient (R) of 0.335 and weighted average of 22.1%. Similarly, the statistical analysis conducted on geographies consisting of 468,706,770 people shows a substantial positive correlation between the proportion of Africans and percentage of population with a disability between the ages 65 and 75 in the United States with a correlation coefficient (R) of 0.508 and weighted average of 26.2%, a difference of 18.6%.
Immigrants from Southern Europe vs African Disability Age 65 to 74

Disability Age 65 to 74 Correlation Summary

MeasurementImmigrants from Southern EuropeAfrican
Minimum3.5%14.8%
Maximum66.7%80.6%
Range63.2%65.7%
Mean25.3%33.2%
Median22.0%29.0%
Interquartile 25% (IQ1)19.4%26.2%
Interquartile 75% (IQ3)24.9%34.8%
Interquartile Range (IQR)5.6%8.6%
Standard Deviation (Sample)11.6%13.0%
Standard Deviation (Population)11.5%12.9%

Similar Demographics by Disability Age 65 to 74

Demographics Similar to Immigrants from Southern Europe by Disability Age 65 to 74

In terms of disability age 65 to 74, the demographic groups most similar to Immigrants from Southern Europe are Immigrants from North America (22.1%, a difference of 0.15%), Jordanian (22.2%, a difference of 0.21%), Immigrants from Colombia (22.2%, a difference of 0.24%), Romanian (22.1%, a difference of 0.26%), and Immigrants from Chile (22.1%, a difference of 0.32%).
DemographicsRating | RankDisability Age 65 to 74
Italians
97.9
/100
|
#90
Exceptional
22.0%
Chileans
97.9
/100
|
#91
Exceptional
22.0%
Poles
97.8
/100
|
#92
Exceptional
22.0%
Immigrants | Canada
97.8
/100
|
#93
Exceptional
22.1%
Immigrants | Chile
97.7
/100
|
#94
Exceptional
22.1%
Romanians
97.7
/100
|
#95
Exceptional
22.1%
Immigrants | North America
97.5
/100
|
#96
Exceptional
22.1%
Immigrants | Southern Europe
97.2
/100
|
#97
Exceptional
22.1%
Jordanians
96.9
/100
|
#98
Exceptional
22.2%
Immigrants | Colombia
96.8
/100
|
#99
Exceptional
22.2%
Uruguayans
96.5
/100
|
#100
Exceptional
22.2%
Immigrants | England
96.5
/100
|
#101
Exceptional
22.2%
Immigrants | Saudi Arabia
96.4
/100
|
#102
Exceptional
22.2%
South Americans
96.4
/100
|
#103
Exceptional
22.2%
Colombians
96.4
/100
|
#104
Exceptional
22.2%

Demographics Similar to Africans by Disability Age 65 to 74

In terms of disability age 65 to 74, the demographic groups most similar to Africans are Immigrants from Cabo Verde (26.3%, a difference of 0.31%), Mexican American Indian (26.2%, a difference of 0.32%), Immigrants from Laos (26.1%, a difference of 0.41%), Immigrants from Micronesia (26.1%, a difference of 0.48%), and Spanish American Indian (26.4%, a difference of 0.50%).
DemographicsRating | RankDisability Age 65 to 74
Delaware
0.1
/100
|
#282
Tragic
25.9%
Spanish Americans
0.0
/100
|
#283
Tragic
25.9%
Immigrants | Azores
0.0
/100
|
#284
Tragic
26.0%
Immigrants | Congo
0.0
/100
|
#285
Tragic
26.0%
Immigrants | Micronesia
0.0
/100
|
#286
Tragic
26.1%
Immigrants | Laos
0.0
/100
|
#287
Tragic
26.1%
Mexican American Indians
0.0
/100
|
#288
Tragic
26.2%
Africans
0.0
/100
|
#289
Tragic
26.2%
Immigrants | Cabo Verde
0.0
/100
|
#290
Tragic
26.3%
Spanish American Indians
0.0
/100
|
#291
Tragic
26.4%
Blackfeet
0.0
/100
|
#292
Tragic
26.6%
Immigrants | Central America
0.0
/100
|
#293
Tragic
26.6%
Dominicans
0.0
/100
|
#294
Tragic
26.7%
Hispanics or Latinos
0.0
/100
|
#295
Tragic
26.7%
Bangladeshis
0.0
/100
|
#296
Tragic
26.8%