Immigrants from South America vs Costa Rican Ambulatory Disability
COMPARE
Immigrants from South America
Costa Rican
Ambulatory Disability
Ambulatory Disability Comparison
Immigrants from South America
Costa Ricans
5.8%
AMBULATORY DISABILITY
97.9/ 100
METRIC RATING
101st/ 347
METRIC RANK
5.9%
AMBULATORY DISABILITY
92.6/ 100
METRIC RATING
121st/ 347
METRIC RANK
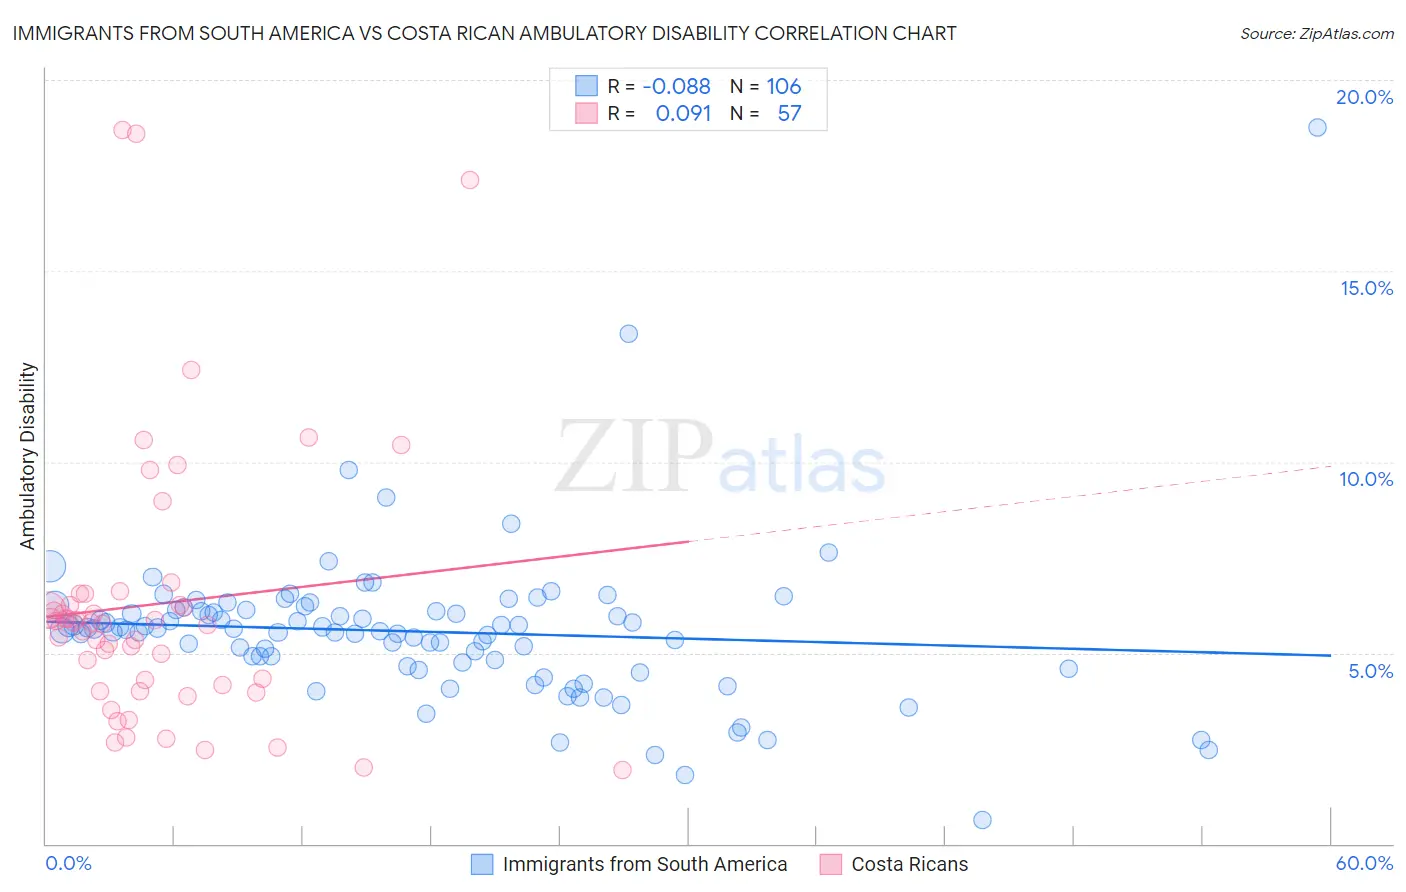
Immigrants from South America vs Costa Rican Ambulatory Disability Correlation Chart
The statistical analysis conducted on geographies consisting of 486,161,675 people shows a slight negative correlation between the proportion of Immigrants from South America and percentage of population with ambulatory disability in the United States with a correlation coefficient (R) of -0.088 and weighted average of 5.8%. Similarly, the statistical analysis conducted on geographies consisting of 253,560,556 people shows a slight positive correlation between the proportion of Costa Ricans and percentage of population with ambulatory disability in the United States with a correlation coefficient (R) of 0.091 and weighted average of 5.9%, a difference of 1.9%.
Ambulatory Disability Correlation Summary
| Measurement | Immigrants from South America | Costa Rican |
| Minimum | 0.63% | 1.9% |
| Maximum | 18.8% | 18.7% |
| Range | 18.1% | 16.8% |
| Mean | 5.6% | 6.3% |
| Median | 5.6% | 5.8% |
| Interquartile 25% (IQ1) | 4.7% | 4.1% |
| Interquartile 75% (IQ3) | 6.1% | 6.4% |
| Interquartile Range (IQR) | 1.4% | 2.3% |
| Standard Deviation (Sample) | 2.1% | 3.6% |
| Standard Deviation (Population) | 2.0% | 3.6% |
Demographics Similar to Immigrants from South America and Costa Ricans by Ambulatory Disability
In terms of ambulatory disability, the demographic groups most similar to Immigrants from South America are Immigrants from Kenya (5.8%, a difference of 0.080%), Immigrants from Romania (5.8%, a difference of 0.15%), New Zealander (5.8%, a difference of 0.21%), Immigrants from Czechoslovakia (5.8%, a difference of 0.32%), and Immigrants from Morocco (5.8%, a difference of 0.39%). Similarly, the demographic groups most similar to Costa Ricans are Estonian (5.9%, a difference of 0.070%), Norwegian (5.9%, a difference of 0.11%), Russian (5.9%, a difference of 0.18%), Immigrants from South Eastern Asia (5.9%, a difference of 0.22%), and Immigrants from Africa (5.9%, a difference of 0.50%).
| Demographics | Rating | Rank | Ambulatory Disability |
| Immigrants | South America | 97.9 /100 | #101 | Exceptional 5.8% |
| Immigrants | Kenya | 97.8 /100 | #102 | Exceptional 5.8% |
| Immigrants | Romania | 97.7 /100 | #103 | Exceptional 5.8% |
| New Zealanders | 97.6 /100 | #104 | Exceptional 5.8% |
| Immigrants | Czechoslovakia | 97.4 /100 | #105 | Exceptional 5.8% |
| Immigrants | Morocco | 97.3 /100 | #106 | Exceptional 5.8% |
| Uruguayans | 97.2 /100 | #107 | Exceptional 5.8% |
| Colombians | 97.2 /100 | #108 | Exceptional 5.8% |
| Immigrants | Netherlands | 97.1 /100 | #109 | Exceptional 5.8% |
| Immigrants | Colombia | 96.7 /100 | #110 | Exceptional 5.8% |
| Danes | 96.6 /100 | #111 | Exceptional 5.8% |
| South Africans | 96.3 /100 | #112 | Exceptional 5.9% |
| Immigrants | Uruguay | 95.6 /100 | #113 | Exceptional 5.9% |
| Immigrants | Poland | 95.4 /100 | #114 | Exceptional 5.9% |
| South American Indians | 94.8 /100 | #115 | Exceptional 5.9% |
| Immigrants | Africa | 94.7 /100 | #116 | Exceptional 5.9% |
| Immigrants | South Eastern Asia | 93.6 /100 | #117 | Exceptional 5.9% |
| Russians | 93.4 /100 | #118 | Exceptional 5.9% |
| Norwegians | 93.1 /100 | #119 | Exceptional 5.9% |
| Estonians | 92.9 /100 | #120 | Exceptional 5.9% |
| Costa Ricans | 92.6 /100 | #121 | Exceptional 5.9% |