Immigrants from Scotland vs Dominican Hearing Disability
COMPARE
Immigrants from Scotland
Dominican
Hearing Disability
Hearing Disability Comparison
Immigrants from Scotland
Dominicans
3.3%
HEARING DISABILITY
0.8/ 100
METRIC RATING
245th/ 347
METRIC RANK
2.5%
HEARING DISABILITY
99.8/ 100
METRIC RATING
18th/ 347
METRIC RANK
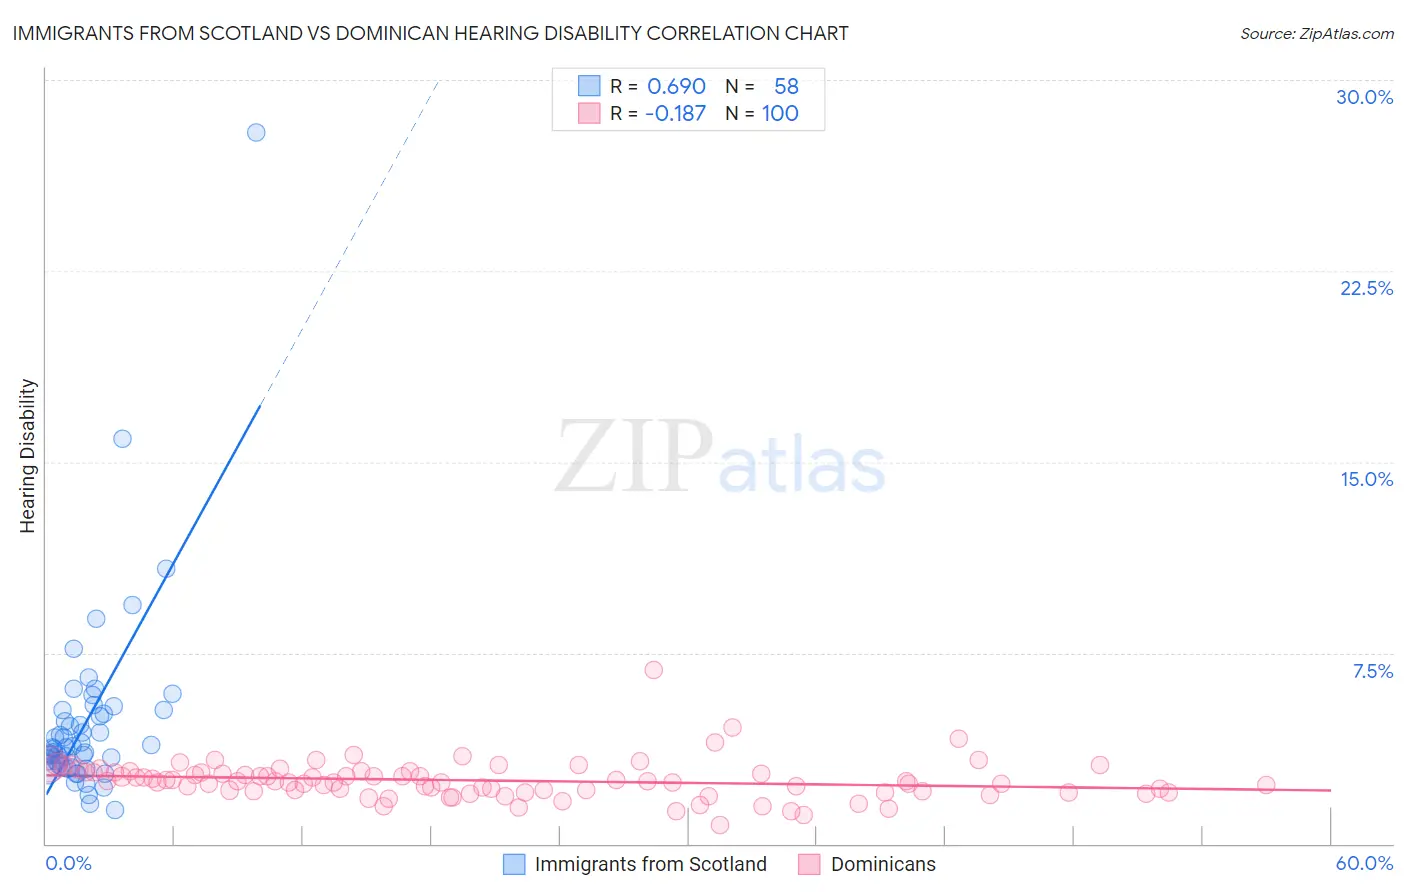
Immigrants from Scotland vs Dominican Hearing Disability Correlation Chart
The statistical analysis conducted on geographies consisting of 196,388,915 people shows a significant positive correlation between the proportion of Immigrants from Scotland and percentage of population with hearing disability in the United States with a correlation coefficient (R) of 0.690 and weighted average of 3.3%. Similarly, the statistical analysis conducted on geographies consisting of 354,884,530 people shows a poor negative correlation between the proportion of Dominicans and percentage of population with hearing disability in the United States with a correlation coefficient (R) of -0.187 and weighted average of 2.5%, a difference of 31.0%.
Hearing Disability Correlation Summary
| Measurement | Immigrants from Scotland | Dominican |
| Minimum | 1.3% | 0.73% |
| Maximum | 27.9% | 6.8% |
| Range | 26.6% | 6.1% |
| Mean | 4.8% | 2.5% |
| Median | 3.8% | 2.4% |
| Interquartile 25% (IQ1) | 3.1% | 2.1% |
| Interquartile 75% (IQ3) | 5.2% | 2.8% |
| Interquartile Range (IQR) | 2.1% | 0.74% |
| Standard Deviation (Sample) | 3.9% | 0.77% |
| Standard Deviation (Population) | 3.9% | 0.76% |
Similar Demographics by Hearing Disability
Demographics Similar to Immigrants from Scotland by Hearing Disability
In terms of hearing disability, the demographic groups most similar to Immigrants from Scotland are Immigrants from England (3.3%, a difference of 0.28%), Assyrian/Chaldean/Syriac (3.3%, a difference of 0.34%), Immigrants from Western Europe (3.3%, a difference of 0.41%), Lithuanian (3.4%, a difference of 0.48%), and Yugoslavian (3.3%, a difference of 0.58%).
| Demographics | Rating | Rank | Hearing Disability |
| German Russians | 1.8 /100 | #238 | Tragic 3.3% |
| Nepalese | 1.2 /100 | #239 | Tragic 3.3% |
| Immigrants | Netherlands | 1.1 /100 | #240 | Tragic 3.3% |
| Samoans | 1.1 /100 | #241 | Tragic 3.3% |
| Yugoslavians | 1.0 /100 | #242 | Tragic 3.3% |
| Immigrants | Western Europe | 1.0 /100 | #243 | Tragic 3.3% |
| Assyrians/Chaldeans/Syriacs | 0.9 /100 | #244 | Tragic 3.3% |
| Immigrants | Scotland | 0.8 /100 | #245 | Tragic 3.3% |
| Immigrants | England | 0.7 /100 | #246 | Tragic 3.3% |
| Lithuanians | 0.6 /100 | #247 | Tragic 3.4% |
| Austrians | 0.6 /100 | #248 | Tragic 3.4% |
| Italians | 0.4 /100 | #249 | Tragic 3.4% |
| Yuman | 0.4 /100 | #250 | Tragic 3.4% |
| Hungarians | 0.4 /100 | #251 | Tragic 3.4% |
| Croatians | 0.4 /100 | #252 | Tragic 3.4% |
Demographics Similar to Dominicans by Hearing Disability
In terms of hearing disability, the demographic groups most similar to Dominicans are Thai (2.5%, a difference of 0.030%), Immigrants from Bolivia (2.5%, a difference of 0.070%), Ghanaian (2.5%, a difference of 0.14%), Immigrants from Sierra Leone (2.6%, a difference of 0.18%), and Immigrants from Nigeria (2.6%, a difference of 0.68%).
| Demographics | Rating | Rank | Hearing Disability |
| Immigrants | Trinidad and Tobago | 99.9 /100 | #11 | Exceptional 2.5% |
| Trinidadians and Tobagonians | 99.9 /100 | #12 | Exceptional 2.5% |
| Sierra Leoneans | 99.9 /100 | #13 | Exceptional 2.5% |
| Ecuadorians | 99.9 /100 | #14 | Exceptional 2.5% |
| Barbadians | 99.9 /100 | #15 | Exceptional 2.5% |
| Immigrants | West Indies | 99.9 /100 | #16 | Exceptional 2.5% |
| Immigrants | India | 99.9 /100 | #17 | Exceptional 2.5% |
| Dominicans | 99.8 /100 | #18 | Exceptional 2.5% |
| Thais | 99.8 /100 | #19 | Exceptional 2.5% |
| Immigrants | Bolivia | 99.8 /100 | #20 | Exceptional 2.5% |
| Ghanaians | 99.8 /100 | #21 | Exceptional 2.5% |
| Immigrants | Sierra Leone | 99.8 /100 | #22 | Exceptional 2.6% |
| Immigrants | Nigeria | 99.8 /100 | #23 | Exceptional 2.6% |
| Immigrants | Ghana | 99.8 /100 | #24 | Exceptional 2.6% |
| Immigrants | El Salvador | 99.7 /100 | #25 | Exceptional 2.6% |