Immigrants from Jamaica vs Dominican Hearing Disability
COMPARE
Immigrants from Jamaica
Dominican
Hearing Disability
Hearing Disability Comparison
Immigrants from Jamaica
Dominicans
2.6%
HEARING DISABILITY
99.5/ 100
METRIC RATING
38th/ 347
METRIC RANK
2.5%
HEARING DISABILITY
99.8/ 100
METRIC RATING
18th/ 347
METRIC RANK
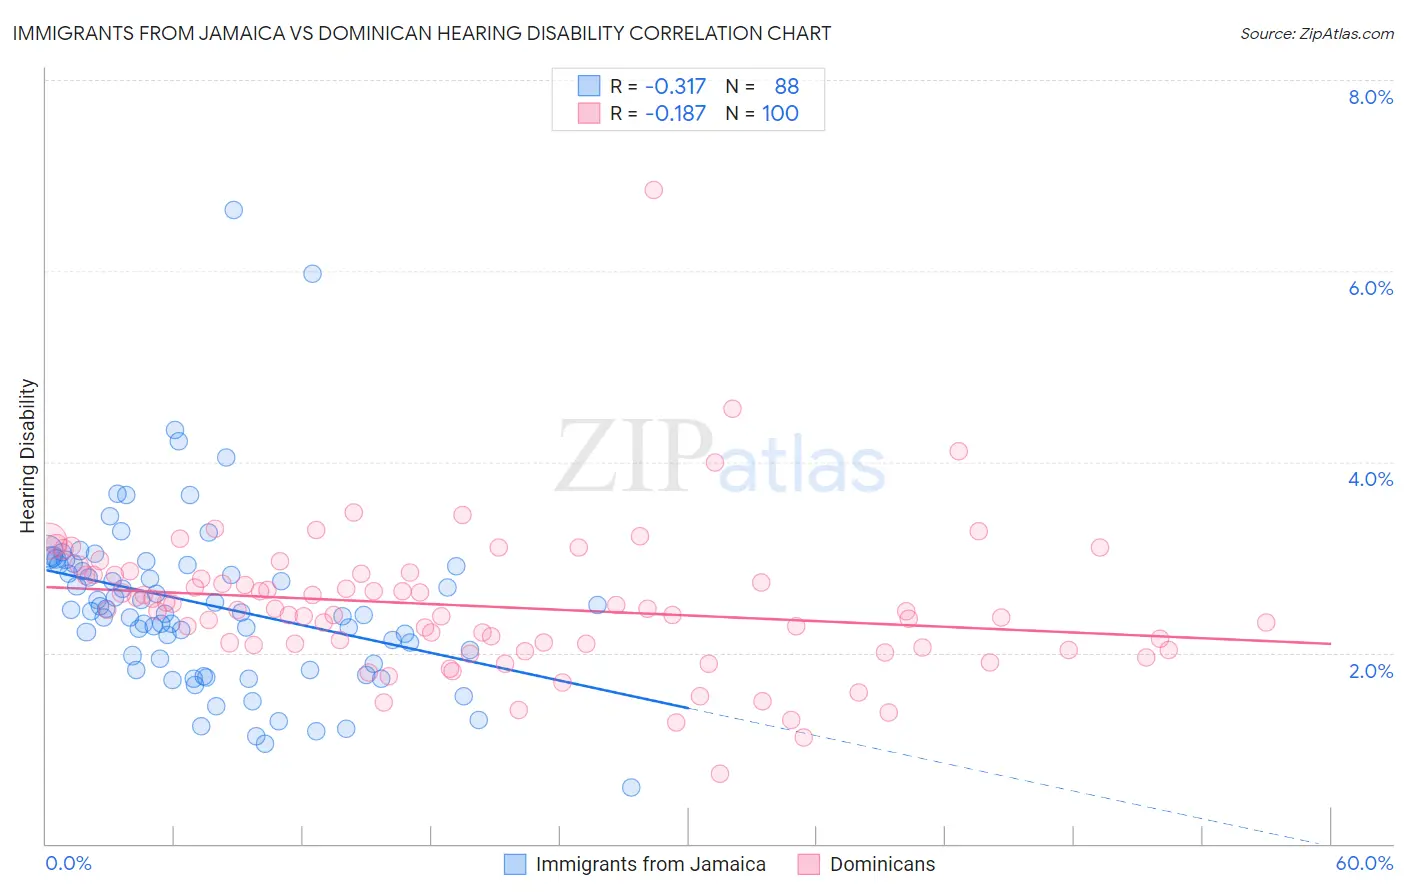
Immigrants from Jamaica vs Dominican Hearing Disability Correlation Chart
The statistical analysis conducted on geographies consisting of 301,631,543 people shows a mild negative correlation between the proportion of Immigrants from Jamaica and percentage of population with hearing disability in the United States with a correlation coefficient (R) of -0.317 and weighted average of 2.6%. Similarly, the statistical analysis conducted on geographies consisting of 354,884,530 people shows a poor negative correlation between the proportion of Dominicans and percentage of population with hearing disability in the United States with a correlation coefficient (R) of -0.187 and weighted average of 2.5%, a difference of 2.8%.
Hearing Disability Correlation Summary
| Measurement | Immigrants from Jamaica | Dominican |
| Minimum | 0.58% | 0.73% |
| Maximum | 6.6% | 6.8% |
| Range | 6.0% | 6.1% |
| Mean | 2.5% | 2.5% |
| Median | 2.4% | 2.4% |
| Interquartile 25% (IQ1) | 1.9% | 2.1% |
| Interquartile 75% (IQ3) | 2.9% | 2.8% |
| Interquartile Range (IQR) | 1.0% | 0.74% |
| Standard Deviation (Sample) | 0.92% | 0.77% |
| Standard Deviation (Population) | 0.92% | 0.76% |
Demographics Similar to Immigrants from Jamaica and Dominicans by Hearing Disability
In terms of hearing disability, the demographic groups most similar to Immigrants from Jamaica are Immigrants from Western Africa (2.6%, a difference of 0.080%), Okinawan (2.6%, a difference of 0.11%), Salvadoran (2.6%, a difference of 0.33%), Immigrants from Pakistan (2.6%, a difference of 0.45%), and Filipino (2.6%, a difference of 0.49%). Similarly, the demographic groups most similar to Dominicans are Thai (2.5%, a difference of 0.030%), Immigrants from Bolivia (2.5%, a difference of 0.070%), Ghanaian (2.5%, a difference of 0.14%), Immigrants from Sierra Leone (2.6%, a difference of 0.18%), and Immigrants from Nigeria (2.6%, a difference of 0.68%).
| Demographics | Rating | Rank | Hearing Disability |
| Dominicans | 99.8 /100 | #18 | Exceptional 2.5% |
| Thais | 99.8 /100 | #19 | Exceptional 2.5% |
| Immigrants | Bolivia | 99.8 /100 | #20 | Exceptional 2.5% |
| Ghanaians | 99.8 /100 | #21 | Exceptional 2.5% |
| Immigrants | Sierra Leone | 99.8 /100 | #22 | Exceptional 2.6% |
| Immigrants | Nigeria | 99.8 /100 | #23 | Exceptional 2.6% |
| Immigrants | Ghana | 99.8 /100 | #24 | Exceptional 2.6% |
| Immigrants | El Salvador | 99.7 /100 | #25 | Exceptional 2.6% |
| Immigrants | Senegal | 99.7 /100 | #26 | Exceptional 2.6% |
| Immigrants | South Central Asia | 99.7 /100 | #27 | Exceptional 2.6% |
| Immigrants | Haiti | 99.7 /100 | #28 | Exceptional 2.6% |
| Bolivians | 99.7 /100 | #29 | Exceptional 2.6% |
| Immigrants | Caribbean | 99.7 /100 | #30 | Exceptional 2.6% |
| Immigrants | Cameroon | 99.7 /100 | #31 | Exceptional 2.6% |
| Immigrants | Venezuela | 99.7 /100 | #32 | Exceptional 2.6% |
| Filipinos | 99.6 /100 | #33 | Exceptional 2.6% |
| Immigrants | Pakistan | 99.6 /100 | #34 | Exceptional 2.6% |
| Salvadorans | 99.6 /100 | #35 | Exceptional 2.6% |
| Okinawans | 99.6 /100 | #36 | Exceptional 2.6% |
| Immigrants | Western Africa | 99.6 /100 | #37 | Exceptional 2.6% |
| Immigrants | Jamaica | 99.5 /100 | #38 | Exceptional 2.6% |