Immigrants from Pakistan vs Immigrants from El Salvador Disability Age 65 to 74
COMPARE
Immigrants from Pakistan
Immigrants from El Salvador
Disability Age 65 to 74
Disability Age 65 to 74 Comparison
Immigrants from Pakistan
Immigrants from El Salvador
21.5%
DISABILITY AGE 65 TO 74
99.5/ 100
METRIC RATING
58th/ 347
METRIC RANK
25.1%
DISABILITY AGE 65 TO 74
0.6/ 100
METRIC RATING
252nd/ 347
METRIC RANK
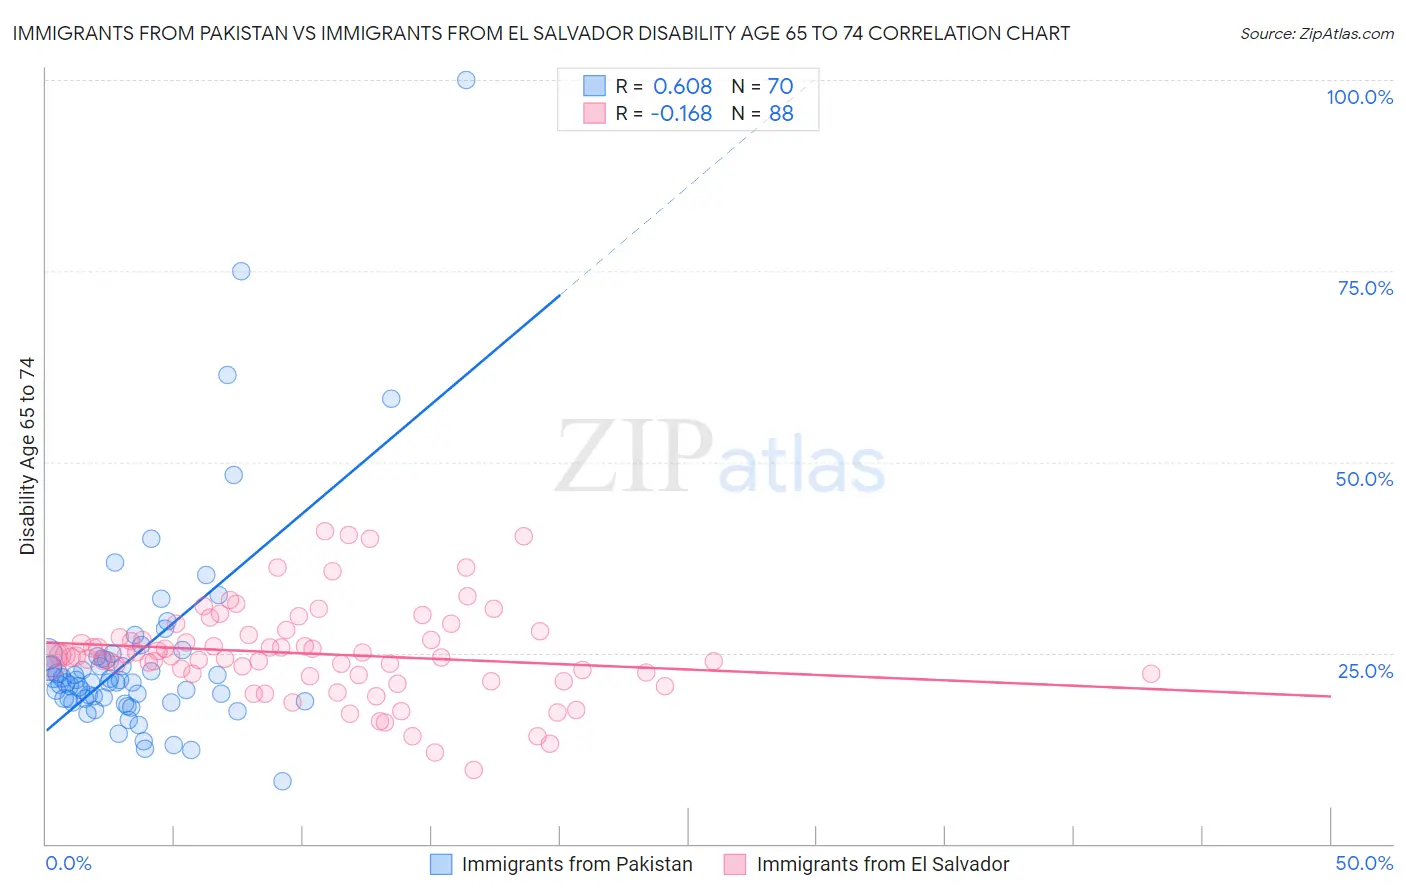
Immigrants from Pakistan vs Immigrants from El Salvador Disability Age 65 to 74 Correlation Chart
The statistical analysis conducted on geographies consisting of 283,535,607 people shows a significant positive correlation between the proportion of Immigrants from Pakistan and percentage of population with a disability between the ages 65 and 75 in the United States with a correlation coefficient (R) of 0.608 and weighted average of 21.5%. Similarly, the statistical analysis conducted on geographies consisting of 357,338,869 people shows a poor negative correlation between the proportion of Immigrants from El Salvador and percentage of population with a disability between the ages 65 and 75 in the United States with a correlation coefficient (R) of -0.168 and weighted average of 25.1%, a difference of 16.4%.
Disability Age 65 to 74 Correlation Summary
| Measurement | Immigrants from Pakistan | Immigrants from El Salvador |
| Minimum | 8.2% | 9.7% |
| Maximum | 100.0% | 40.8% |
| Range | 91.8% | 31.1% |
| Mean | 24.9% | 24.9% |
| Median | 21.1% | 24.6% |
| Interquartile 25% (IQ1) | 19.0% | 22.1% |
| Interquartile 75% (IQ3) | 24.6% | 27.2% |
| Interquartile Range (IQR) | 5.7% | 5.0% |
| Standard Deviation (Sample) | 14.2% | 6.1% |
| Standard Deviation (Population) | 14.1% | 6.0% |
Similar Demographics by Disability Age 65 to 74
Demographics Similar to Immigrants from Pakistan by Disability Age 65 to 74
In terms of disability age 65 to 74, the demographic groups most similar to Immigrants from Pakistan are Immigrants from Asia (21.5%, a difference of 0.030%), Zimbabwean (21.5%, a difference of 0.030%), Immigrants from North Macedonia (21.6%, a difference of 0.060%), Egyptian (21.6%, a difference of 0.090%), and Carpatho Rusyn (21.6%, a difference of 0.11%).
| Demographics | Rating | Rank | Disability Age 65 to 74 |
| Immigrants | Serbia | 99.6 /100 | #51 | Exceptional 21.4% |
| Immigrants | France | 99.6 /100 | #52 | Exceptional 21.5% |
| Bhutanese | 99.6 /100 | #53 | Exceptional 21.5% |
| Immigrants | Italy | 99.6 /100 | #54 | Exceptional 21.5% |
| Immigrants | Romania | 99.5 /100 | #55 | Exceptional 21.5% |
| Immigrants | Denmark | 99.5 /100 | #56 | Exceptional 21.5% |
| Immigrants | Asia | 99.5 /100 | #57 | Exceptional 21.5% |
| Immigrants | Pakistan | 99.5 /100 | #58 | Exceptional 21.5% |
| Zimbabweans | 99.5 /100 | #59 | Exceptional 21.5% |
| Immigrants | North Macedonia | 99.5 /100 | #60 | Exceptional 21.6% |
| Egyptians | 99.5 /100 | #61 | Exceptional 21.6% |
| Carpatho Rusyns | 99.5 /100 | #62 | Exceptional 21.6% |
| Immigrants | Europe | 99.4 /100 | #63 | Exceptional 21.6% |
| Immigrants | Latvia | 99.4 /100 | #64 | Exceptional 21.6% |
| Immigrants | Russia | 99.4 /100 | #65 | Exceptional 21.6% |
Demographics Similar to Immigrants from El Salvador by Disability Age 65 to 74
In terms of disability age 65 to 74, the demographic groups most similar to Immigrants from El Salvador are Subsaharan African (25.1%, a difference of 0.030%), Somali (25.1%, a difference of 0.11%), Nonimmigrants (25.0%, a difference of 0.19%), Central American (25.1%, a difference of 0.27%), and Salvadoran (25.0%, a difference of 0.39%).
| Demographics | Rating | Rank | Disability Age 65 to 74 |
| British West Indians | 2.0 /100 | #245 | Tragic 24.7% |
| Immigrants | Iraq | 1.9 /100 | #246 | Tragic 24.7% |
| Indonesians | 1.1 /100 | #247 | Tragic 24.9% |
| Senegalese | 0.9 /100 | #248 | Tragic 24.9% |
| Immigrants | Fiji | 0.8 /100 | #249 | Tragic 25.0% |
| Salvadorans | 0.8 /100 | #250 | Tragic 25.0% |
| Immigrants | Nonimmigrants | 0.7 /100 | #251 | Tragic 25.0% |
| Immigrants | El Salvador | 0.6 /100 | #252 | Tragic 25.1% |
| Sub-Saharan Africans | 0.6 /100 | #253 | Tragic 25.1% |
| Somalis | 0.6 /100 | #254 | Tragic 25.1% |
| Central Americans | 0.5 /100 | #255 | Tragic 25.1% |
| Immigrants | Somalia | 0.4 /100 | #256 | Tragic 25.2% |
| Guamanians/Chamorros | 0.3 /100 | #257 | Tragic 25.3% |
| Marshallese | 0.3 /100 | #258 | Tragic 25.3% |
| Immigrants | Cambodia | 0.3 /100 | #259 | Tragic 25.3% |