Immigrants from North America vs Colville Female Disability
COMPARE
Immigrants from North America
Colville
Female Disability
Female Disability Comparison
Immigrants from North America
Colville
12.3%
FEMALE DISABILITY
32.8/ 100
METRIC RATING
188th/ 347
METRIC RANK
15.1%
FEMALE DISABILITY
0.0/ 100
METRIC RATING
339th/ 347
METRIC RANK
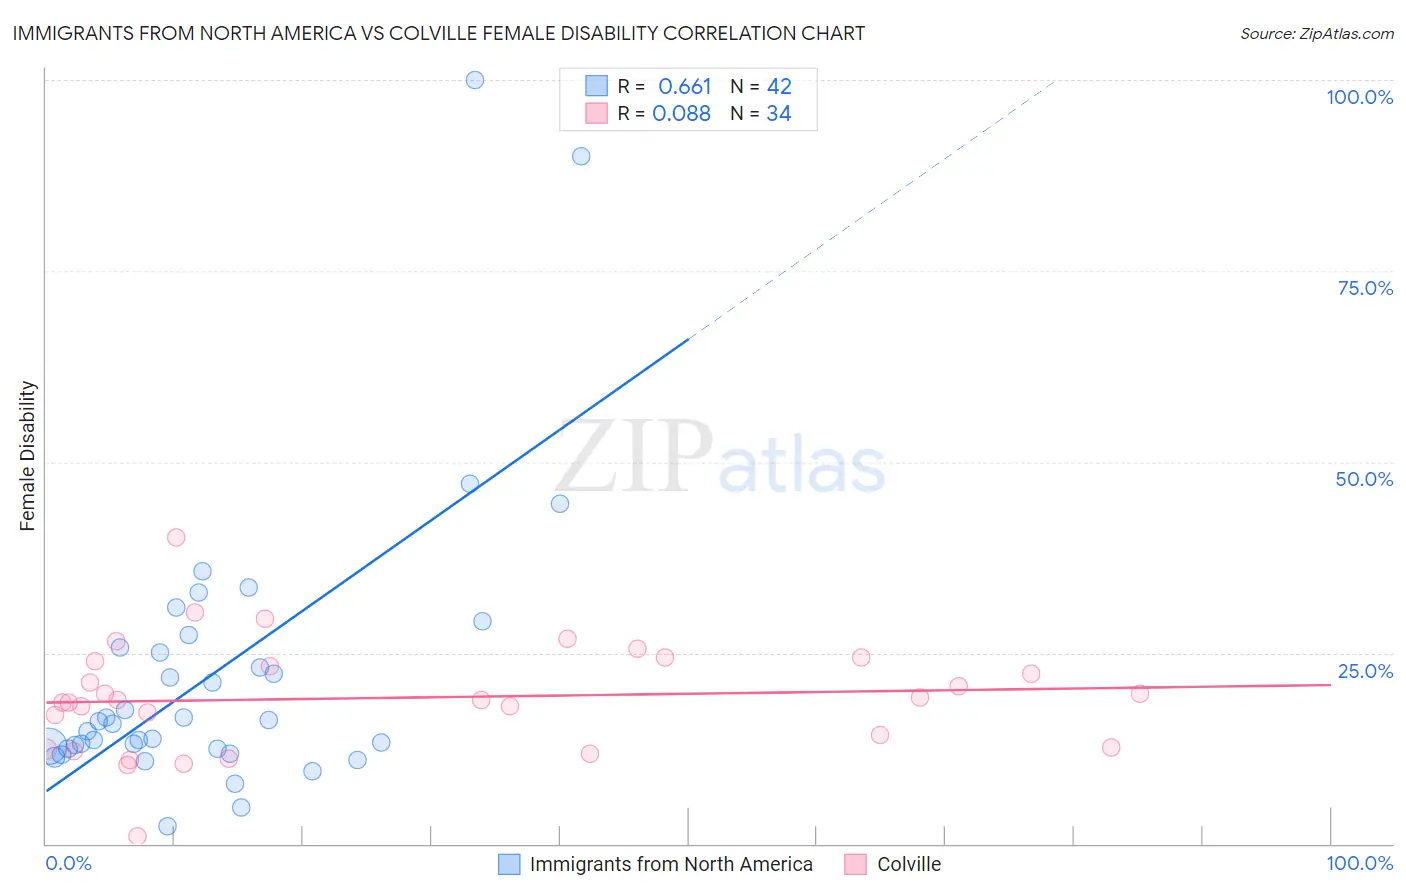
Immigrants from North America vs Colville Female Disability Correlation Chart
The statistical analysis conducted on geographies consisting of 462,407,592 people shows a significant positive correlation between the proportion of Immigrants from North America and percentage of females with a disability in the United States with a correlation coefficient (R) of 0.661 and weighted average of 12.3%. Similarly, the statistical analysis conducted on geographies consisting of 34,687,480 people shows a slight positive correlation between the proportion of Colville and percentage of females with a disability in the United States with a correlation coefficient (R) of 0.088 and weighted average of 15.1%, a difference of 22.7%.
Female Disability Correlation Summary
| Measurement | Immigrants from North America | Colville |
| Minimum | 2.3% | 0.95% |
| Maximum | 100.0% | 40.0% |
| Range | 97.7% | 39.1% |
| Mean | 22.3% | 19.1% |
| Median | 15.9% | 18.9% |
| Interquartile 25% (IQ1) | 12.5% | 12.7% |
| Interquartile 75% (IQ3) | 25.7% | 23.9% |
| Interquartile Range (IQR) | 13.2% | 11.3% |
| Standard Deviation (Sample) | 19.2% | 7.3% |
| Standard Deviation (Population) | 19.0% | 7.2% |
Similar Demographics by Female Disability
Demographics Similar to Immigrants from North America by Female Disability
In terms of female disability, the demographic groups most similar to Immigrants from North America are Serbian (12.3%, a difference of 0.010%), Austrian (12.3%, a difference of 0.020%), Immigrants from Uzbekistan (12.3%, a difference of 0.050%), Immigrants from Albania (12.3%, a difference of 0.050%), and Immigrants from Honduras (12.3%, a difference of 0.060%).
| Demographics | Rating | Rank | Female Disability |
| Immigrants | Canada | 37.2 /100 | #181 | Fair 12.3% |
| Norwegians | 36.9 /100 | #182 | Fair 12.3% |
| Cubans | 36.5 /100 | #183 | Fair 12.3% |
| Iraqis | 36.0 /100 | #184 | Fair 12.3% |
| Immigrants | Uzbekistan | 33.9 /100 | #185 | Fair 12.3% |
| Austrians | 33.3 /100 | #186 | Fair 12.3% |
| Serbians | 33.1 /100 | #187 | Fair 12.3% |
| Immigrants | North America | 32.8 /100 | #188 | Fair 12.3% |
| Immigrants | Albania | 31.6 /100 | #189 | Fair 12.3% |
| Immigrants | Honduras | 31.3 /100 | #190 | Fair 12.3% |
| Armenians | 29.7 /100 | #191 | Fair 12.3% |
| Immigrants | Western Africa | 29.2 /100 | #192 | Fair 12.3% |
| Northern Europeans | 27.5 /100 | #193 | Fair 12.3% |
| Ukrainians | 27.2 /100 | #194 | Fair 12.3% |
| Swedes | 26.6 /100 | #195 | Fair 12.3% |
Demographics Similar to Colville by Female Disability
In terms of female disability, the demographic groups most similar to Colville are Dutch West Indian (15.0%, a difference of 0.40%), Tohono O'odham (15.0%, a difference of 0.55%), Seminole (15.0%, a difference of 0.67%), Chickasaw (15.2%, a difference of 0.95%), and Cajun (14.9%, a difference of 1.3%).
| Demographics | Rating | Rank | Female Disability |
| Pima | 0.0 /100 | #332 | Tragic 14.8% |
| Immigrants | Azores | 0.0 /100 | #333 | Tragic 14.9% |
| Cherokee | 0.0 /100 | #334 | Tragic 14.9% |
| Cajuns | 0.0 /100 | #335 | Tragic 14.9% |
| Seminole | 0.0 /100 | #336 | Tragic 15.0% |
| Tohono O'odham | 0.0 /100 | #337 | Tragic 15.0% |
| Dutch West Indians | 0.0 /100 | #338 | Tragic 15.0% |
| Colville | 0.0 /100 | #339 | Tragic 15.1% |
| Chickasaw | 0.0 /100 | #340 | Tragic 15.2% |
| Choctaw | 0.0 /100 | #341 | Tragic 15.4% |
| Creek | 0.0 /100 | #342 | Tragic 15.7% |
| Lumbee | 0.0 /100 | #343 | Tragic 15.8% |
| Kiowa | 0.0 /100 | #344 | Tragic 15.8% |
| Puerto Ricans | 0.0 /100 | #345 | Tragic 16.6% |
| Tsimshian | 0.0 /100 | #346 | Tragic 16.8% |