Immigrants from Nigeria vs Puerto Rican Disability Age 65 to 74
COMPARE
Immigrants from Nigeria
Puerto Rican
Disability Age 65 to 74
Disability Age 65 to 74 Comparison
Immigrants from Nigeria
Puerto Ricans
24.0%
DISABILITY AGE 65 TO 74
11.7/ 100
METRIC RATING
218th/ 347
METRIC RANK
29.1%
DISABILITY AGE 65 TO 74
0.0/ 100
METRIC RATING
323rd/ 347
METRIC RANK
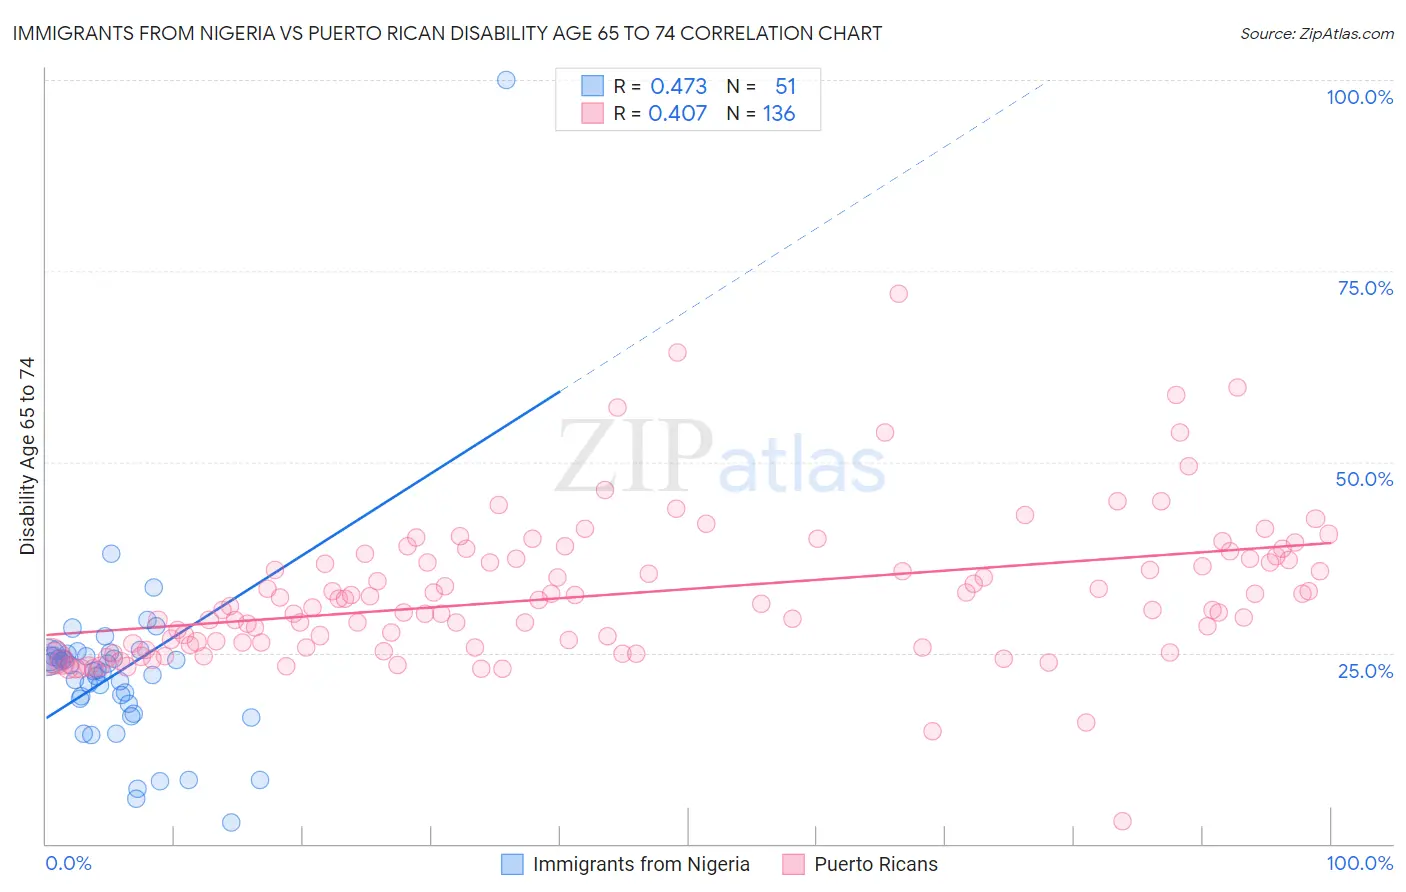
Immigrants from Nigeria vs Puerto Rican Disability Age 65 to 74 Correlation Chart
The statistical analysis conducted on geographies consisting of 283,043,731 people shows a moderate positive correlation between the proportion of Immigrants from Nigeria and percentage of population with a disability between the ages 65 and 75 in the United States with a correlation coefficient (R) of 0.473 and weighted average of 24.0%. Similarly, the statistical analysis conducted on geographies consisting of 526,448,167 people shows a moderate positive correlation between the proportion of Puerto Ricans and percentage of population with a disability between the ages 65 and 75 in the United States with a correlation coefficient (R) of 0.407 and weighted average of 29.1%, a difference of 21.3%.
Disability Age 65 to 74 Correlation Summary
| Measurement | Immigrants from Nigeria | Puerto Rican |
| Minimum | 2.8% | 2.9% |
| Maximum | 100.0% | 72.0% |
| Range | 97.2% | 69.1% |
| Mean | 22.5% | 32.6% |
| Median | 22.7% | 31.0% |
| Interquartile 25% (IQ1) | 18.3% | 25.9% |
| Interquartile 75% (IQ3) | 24.5% | 37.2% |
| Interquartile Range (IQR) | 6.2% | 11.3% |
| Standard Deviation (Sample) | 13.0% | 9.5% |
| Standard Deviation (Population) | 12.9% | 9.5% |
Similar Demographics by Disability Age 65 to 74
Demographics Similar to Immigrants from Nigeria by Disability Age 65 to 74
In terms of disability age 65 to 74, the demographic groups most similar to Immigrants from Nigeria are Immigrants from Portugal (24.0%, a difference of 0.0%), Immigrants from Burma/Myanmar (24.0%, a difference of 0.020%), Jamaican (24.0%, a difference of 0.070%), Ghanaian (24.1%, a difference of 0.19%), and Pennsylvania German (24.0%, a difference of 0.20%).
| Demographics | Rating | Rank | Disability Age 65 to 74 |
| Immigrants | West Indies | 15.9 /100 | #211 | Poor 23.9% |
| French | 15.7 /100 | #212 | Poor 23.9% |
| Nicaraguans | 14.3 /100 | #213 | Poor 23.9% |
| Immigrants | Oceania | 13.6 /100 | #214 | Poor 24.0% |
| Pennsylvania Germans | 13.3 /100 | #215 | Poor 24.0% |
| Jamaicans | 12.2 /100 | #216 | Poor 24.0% |
| Immigrants | Portugal | 11.7 /100 | #217 | Poor 24.0% |
| Immigrants | Nigeria | 11.7 /100 | #218 | Poor 24.0% |
| Immigrants | Burma/Myanmar | 11.6 /100 | #219 | Poor 24.0% |
| Ghanaians | 10.4 /100 | #220 | Poor 24.1% |
| Immigrants | Nicaragua | 9.8 /100 | #221 | Tragic 24.1% |
| Native Hawaiians | 9.3 /100 | #222 | Tragic 24.1% |
| Immigrants | Middle Africa | 8.9 /100 | #223 | Tragic 24.1% |
| Immigrants | Panama | 8.6 /100 | #224 | Tragic 24.1% |
| Bermudans | 8.2 /100 | #225 | Tragic 24.2% |
Demographics Similar to Puerto Ricans by Disability Age 65 to 74
In terms of disability age 65 to 74, the demographic groups most similar to Puerto Ricans are Seminole (29.4%, a difference of 0.97%), Dutch West Indian (29.6%, a difference of 1.4%), Yakama (29.6%, a difference of 1.7%), Apache (29.7%, a difference of 1.8%), and Aleut (28.4%, a difference of 2.5%).
| Demographics | Rating | Rank | Disability Age 65 to 74 |
| Crow | 0.0 /100 | #316 | Tragic 27.9% |
| Immigrants | Armenia | 0.0 /100 | #317 | Tragic 28.0% |
| Nepalese | 0.0 /100 | #318 | Tragic 28.0% |
| Arapaho | 0.0 /100 | #319 | Tragic 28.1% |
| Cherokee | 0.0 /100 | #320 | Tragic 28.2% |
| Comanche | 0.0 /100 | #321 | Tragic 28.3% |
| Aleuts | 0.0 /100 | #322 | Tragic 28.4% |
| Puerto Ricans | 0.0 /100 | #323 | Tragic 29.1% |
| Seminole | 0.0 /100 | #324 | Tragic 29.4% |
| Dutch West Indians | 0.0 /100 | #325 | Tragic 29.6% |
| Yakama | 0.0 /100 | #326 | Tragic 29.6% |
| Apache | 0.0 /100 | #327 | Tragic 29.7% |
| Hopi | 0.0 /100 | #328 | Tragic 30.0% |
| Choctaw | 0.0 /100 | #329 | Tragic 30.2% |
| Creek | 0.0 /100 | #330 | Tragic 30.2% |