Immigrants from Nepal vs Immigrants from France Hearing Disability

COMPARE

Immigrants from Nepal
Race
Ancestry
AfghanAfricanAlaska NativeAlaskan AthabascanAlbanianAleutAlsatianAmericanApacheArabArapahoArgentineanArmenianAssyrian/Chaldean/SyriacAustralianAustrianBahamianBangladeshiBarbadianBasqueBelgianBelizeanBermudanBhutaneseBlackfeetBolivianBrazilianBritishBritish West IndianBulgarianBurmeseCajunCambodianCanadianCape VerdeanCarpatho RusynCelticCentral AmericanCentral American IndianCherokeeCheyenneChickasawChileanChineseChippewaChoctawColombianColvilleComancheCosta RicanCreeCreekCroatianCrowCubanCypriotCzechCzechoslovakianDanishDelawareDominicanDutchDutch West IndianEastern EuropeanEcuadorianEgyptianEnglishEstonianEthiopianEuropeanFijianFilipinoFinnishFrenchFrench American IndianFrench CanadianGermanGerman RussianGhanaianGreekGuamanian/ChamorroGuatemalanGuyaneseHaitianHmongHonduranHopiHoumaHungarianIcelanderIndian (Asian)IndonesianInupiatIranianIraqiIrishIroquoisIsraeliItalianJamaicanJapaneseJordanianKenyanKiowaKoreanLaotianLatvianLebaneseLiberianLithuanianLumbeeLuxembourgerMacedonianMalaysianMalteseMarshalleseMenomineeMexicanMexican American IndianMongolianMoroccanNative HawaiianNavajoNepaleseNew ZealanderNicaraguanNigerianNorthern EuropeanNorwegianOkinawanOsageOttawaPaiutePakistaniPalestinianPanamanianParaguayanPennsylvania GermanPeruvianPimaPolishPortuguesePotawatomiPuebloPuerto RicanPuget Sound SalishRomanianRussianSalvadoranSamoanScandinavianScotch-IrishScottishSeminoleSenegaleseSerbianShoshoneSierra LeoneanSiouxSlavicSlovakSloveneSomaliSouth AfricanSouth AmericanSouth American IndianSoviet UnionSpaniardSpanishSpanish AmericanSpanish American IndianSri LankanSubsaharan AfricanSudaneseSwedishSwissSyrianTaiwaneseThaiTlingit-HaidaTohono O'OdhamTonganTrinidadian and TobagonianTsimshianTurkishU.S. Virgin IslanderUgandanUkrainianUruguayanUteVenezuelanVietnameseWelshWest IndianYakamaYaquiYugoslavianYumanYup'ikZimbabwean
Immigration
NonimmigrantsImmigrantsAfghanistanAfricaAlbaniaArgentinaArmeniaAsiaAustraliaAustriaBahamasBangladeshBarbadosBelarusBelgiumBelizeBoliviaBosnia and HerzegovinaBrazilBulgariaBurma/MyanmarCabo VerdeCambodiaCameroonCanadaCaribbeanCentral AmericaChileChinaColombiaCongoCosta RicaCroatiaCubaCzechoslovakiaDenmarkDominicaDominican RepublicEastern AfricaEastern AsiaEastern EuropeEcuadorEgyptEl SalvadorEnglandEritreaEthiopiaEuropeFijiGermanyGhanaGreeceGrenadaGuatemalaGuyanaHaitiHondurasHong KongHungaryIndiaIndonesiaIranIraqIrelandIsraelItalyJamaicaJapanJordanKazakhstanKenyaKoreaKuwaitLaosLatin AmericaLatviaLebanonLiberiaLithuaniaMalaysiaMexicoMicronesiaMiddle AfricaMoldovaMoroccoNepalNetherlandsNicaraguaNigeriaNorth AmericaNorth MacedoniaNorthern AfricaNorthern EuropeNorwayOceaniaPakistanPanamaPeruPhilippinesPolandPortugalRomaniaRussiaSaudi ArabiaScotlandSenegalSerbiaSierra LeoneSingaporeSomaliaSouth AfricaSouth AmericaSouth Central AsiaSouth Eastern AsiaSouthern EuropeSpainSri LankaSt. Vincent and the GrenadinesSudanSwedenSwitzerlandSyriaTaiwanThailandTrinidad and TobagoTurkeyUgandaUkraineUruguayUzbekistanVenezuelaVietnamWest IndiesWestern AfricaWestern AsiaWestern EuropeYemenZaireZimbabweAzores
Immigrants from France
Race
Ancestry
AfghanAfricanAlaska NativeAlaskan AthabascanAlbanianAleutAlsatianAmericanApacheArabArapahoArgentineanArmenianAssyrian/Chaldean/SyriacAustralianAustrianBahamianBangladeshiBarbadianBasqueBelgianBelizeanBermudanBhutaneseBlackfeetBolivianBrazilianBritishBritish West IndianBulgarianBurmeseCajunCambodianCanadianCape VerdeanCarpatho RusynCelticCentral AmericanCentral American IndianCherokeeCheyenneChickasawChileanChineseChippewaChoctawColombianColvilleComancheCosta RicanCreeCreekCroatianCrowCubanCypriotCzechCzechoslovakianDanishDelawareDominicanDutchDutch West IndianEastern EuropeanEcuadorianEgyptianEnglishEstonianEthiopianEuropeanFijianFilipinoFinnishFrenchFrench American IndianFrench CanadianGermanGerman RussianGhanaianGreekGuamanian/ChamorroGuatemalanGuyaneseHaitianHmongHonduranHopiHoumaHungarianIcelanderIndian (Asian)IndonesianInupiatIranianIraqiIrishIroquoisIsraeliItalianJamaicanJapaneseJordanianKenyanKiowaKoreanLaotianLatvianLebaneseLiberianLithuanianLumbeeLuxembourgerMacedonianMalaysianMalteseMarshalleseMenomineeMexicanMexican American IndianMongolianMoroccanNative HawaiianNavajoNepaleseNew ZealanderNicaraguanNigerianNorthern EuropeanNorwegianOkinawanOsageOttawaPaiutePakistaniPalestinianPanamanianParaguayanPennsylvania GermanPeruvianPimaPolishPortuguesePotawatomiPuebloPuerto RicanPuget Sound SalishRomanianRussianSalvadoranSamoanScandinavianScotch-IrishScottishSeminoleSenegaleseSerbianShoshoneSierra LeoneanSiouxSlavicSlovakSloveneSomaliSouth AfricanSouth AmericanSouth American IndianSoviet UnionSpaniardSpanishSpanish AmericanSpanish American IndianSri LankanSubsaharan AfricanSudaneseSwedishSwissSyrianTaiwaneseThaiTlingit-HaidaTohono O'OdhamTonganTrinidadian and TobagonianTsimshianTurkishU.S. Virgin IslanderUgandanUkrainianUruguayanUteVenezuelanVietnameseWelshWest IndianYakamaYaquiYugoslavianYumanYup'ikZimbabwean
Immigration
NonimmigrantsImmigrantsAfghanistanAfricaAlbaniaArgentinaArmeniaAsiaAustraliaAustriaBahamasBangladeshBarbadosBelarusBelgiumBelizeBoliviaBosnia and HerzegovinaBrazilBulgariaBurma/MyanmarCabo VerdeCambodiaCameroonCanadaCaribbeanCentral AmericaChileChinaColombiaCongoCosta RicaCroatiaCubaCzechoslovakiaDenmarkDominicaDominican RepublicEastern AfricaEastern AsiaEastern EuropeEcuadorEgyptEl SalvadorEnglandEritreaEthiopiaEuropeFijiFranceGermanyGhanaGreeceGrenadaGuatemalaGuyanaHaitiHondurasHong KongHungaryIndiaIndonesiaIranIraqIrelandIsraelItalyJamaicaJapanJordanKazakhstanKenyaKoreaKuwaitLaosLatin AmericaLatviaLebanonLiberiaLithuaniaMalaysiaMexicoMicronesiaMiddle AfricaMoldovaMoroccoNetherlandsNicaraguaNigeriaNorth AmericaNorth MacedoniaNorthern AfricaNorthern EuropeNorwayOceaniaPakistanPanamaPeruPhilippinesPolandPortugalRomaniaRussiaSaudi ArabiaScotlandSenegalSerbiaSierra LeoneSingaporeSomaliaSouth AfricaSouth AmericaSouth Central AsiaSouth Eastern AsiaSouthern EuropeSpainSri LankaSt. Vincent and the GrenadinesSudanSwedenSwitzerlandSyriaTaiwanThailandTrinidad and TobagoTurkeyUgandaUkraineUruguayUzbekistanVenezuelaVietnamWest IndiesWestern AfricaWestern AsiaWestern EuropeYemenZaireZimbabweAzores
Hearing Disability
Income
Poverty
Unemployment
Labor Participation
Family Structure
Vehicle Availability
Education Level
Disability

Hearing Disability Comparison

Immigrants from Nepal

Immigrants from France

Exceptional
Good
2.7%
HEARING DISABILITY
98.3/ 100
METRIC RATING
65th/ 347
METRIC RANK
2.9%
HEARING DISABILITY
73.1/ 100
METRIC RATING
151st/ 347
METRIC RANK

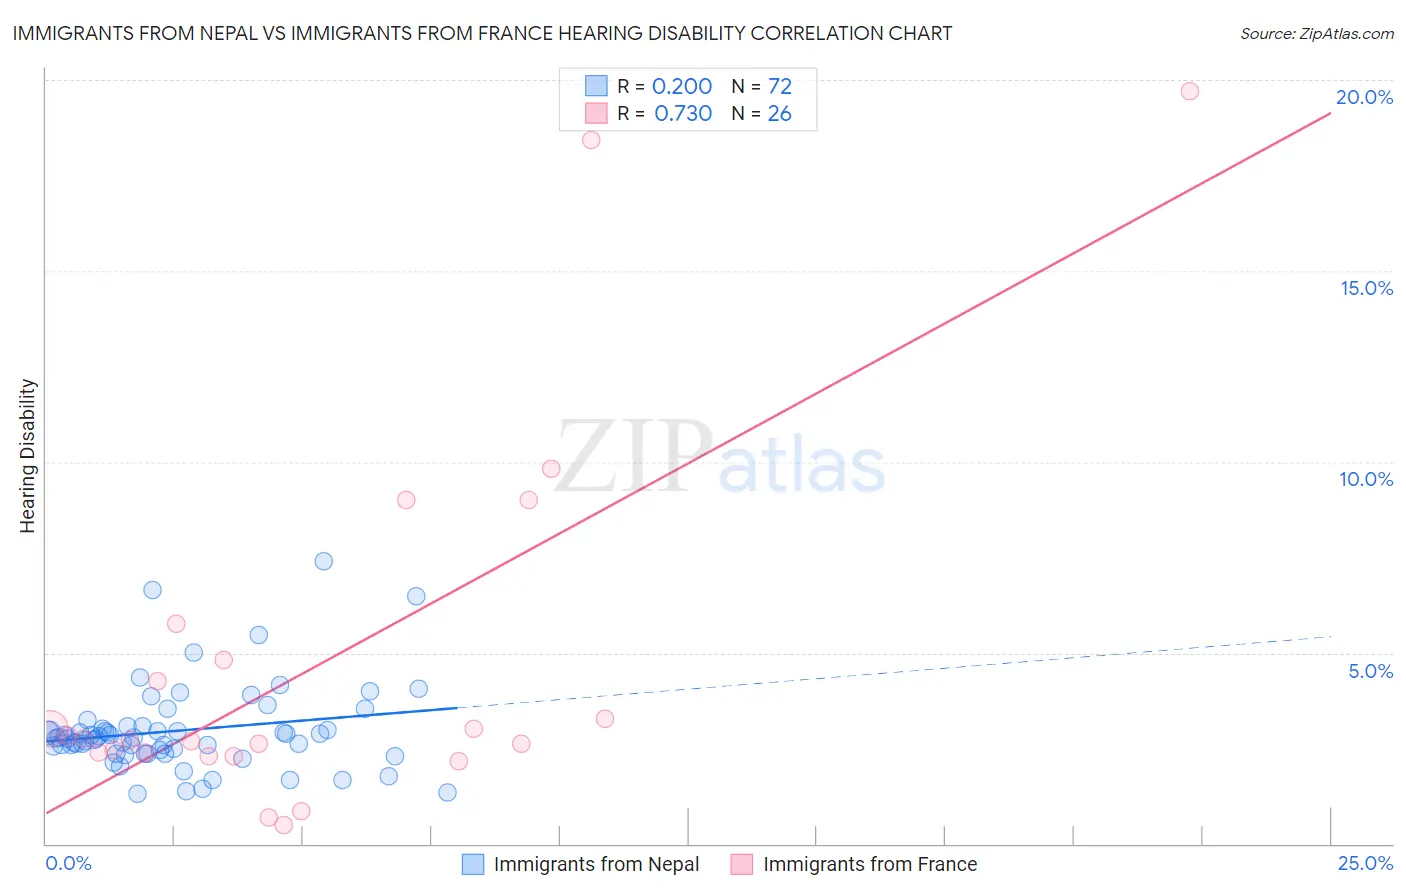
Immigrants from Nepal vs Immigrants from France Hearing Disability Correlation Chart

The statistical analysis conducted on geographies consisting of 186,754,465 people shows a weak positive correlation between the proportion of Immigrants from Nepal and percentage of population with hearing disability in the United States with a correlation coefficient (R) of 0.200 and weighted average of 2.7%. Similarly, the statistical analysis conducted on geographies consisting of 287,858,802 people shows a strong positive correlation between the proportion of Immigrants from France and percentage of population with hearing disability in the United States with a correlation coefficient (R) of 0.730 and weighted average of 2.9%, a difference of 7.9%.
Immigrants from Nepal vs Immigrants from France Hearing Disability

Hearing Disability Correlation Summary

MeasurementImmigrants from NepalImmigrants from France
Minimum1.3%0.48%
Maximum7.4%19.7%
Range6.1%19.2%
Mean3.0%4.7%
Median2.8%2.7%
Interquartile 25% (IQ1)2.4%2.4%
Interquartile 75% (IQ3)3.0%4.8%
Interquartile Range (IQR)0.63%2.4%
Standard Deviation (Sample)1.1%4.9%
Standard Deviation (Population)1.1%4.8%

Similar Demographics by Hearing Disability

Demographics Similar to Immigrants from Nepal by Hearing Disability

In terms of hearing disability, the demographic groups most similar to Immigrants from Nepal are Immigrants from Sri Lanka (2.7%, a difference of 0.080%), Immigrants from Belize (2.7%, a difference of 0.12%), Indian (Asian) (2.7%, a difference of 0.14%), Immigrants from Uzbekistan (2.7%, a difference of 0.19%), and Immigrants from Colombia (2.7%, a difference of 0.19%).
DemographicsRating | RankHearing Disability
Immigrants | Peru
98.6
/100
|
#58
Exceptional
2.7%
Immigrants | Eritrea
98.5
/100
|
#59
Exceptional
2.7%
Immigrants | Egypt
98.5
/100
|
#60
Exceptional
2.7%
Immigrants | Uzbekistan
98.4
/100
|
#61
Exceptional
2.7%
Immigrants | Colombia
98.4
/100
|
#62
Exceptional
2.7%
Indians (Asian)
98.4
/100
|
#63
Exceptional
2.7%
Immigrants | Sri Lanka
98.4
/100
|
#64
Exceptional
2.7%
Immigrants | Nepal
98.3
/100
|
#65
Exceptional
2.7%
Immigrants | Belize
98.2
/100
|
#66
Exceptional
2.7%
Egyptians
98.1
/100
|
#67
Exceptional
2.7%
Immigrants | Africa
98.0
/100
|
#68
Exceptional
2.7%
Nicaraguans
97.9
/100
|
#69
Exceptional
2.7%
Peruvians
97.7
/100
|
#70
Exceptional
2.7%
Central Americans
97.7
/100
|
#71
Exceptional
2.7%
Afghans
97.6
/100
|
#72
Exceptional
2.7%

Demographics Similar to Immigrants from France by Hearing Disability

In terms of hearing disability, the demographic groups most similar to Immigrants from France are Immigrants from Lithuania (2.9%, a difference of 0.010%), Palestinian (2.9%, a difference of 0.060%), Sudanese (2.9%, a difference of 0.12%), Immigrants from Lebanon (2.9%, a difference of 0.19%), and Costa Rican (2.9%, a difference of 0.21%).
DemographicsRating | RankHearing Disability
Immigrants | Bulgaria
79.2
/100
|
#144
Good
2.9%
Immigrants | Congo
78.9
/100
|
#145
Good
2.9%
Brazilians
78.7
/100
|
#146
Good
2.9%
Tongans
78.6
/100
|
#147
Good
2.9%
Immigrants | Russia
77.7
/100
|
#148
Good
2.9%
Immigrants | Panama
76.9
/100
|
#149
Good
2.9%
Palestinians
73.6
/100
|
#150
Good
2.9%
Immigrants | France
73.1
/100
|
#151
Good
2.9%
Immigrants | Lithuania
73.0
/100
|
#152
Good
2.9%
Sudanese
72.1
/100
|
#153
Good
2.9%
Immigrants | Lebanon
71.5
/100
|
#154
Good
2.9%
Costa Ricans
71.4
/100
|
#155
Good
2.9%
Immigrants | Poland
70.2
/100
|
#156
Good
2.9%
Immigrants | Kazakhstan
69.6
/100
|
#157
Good
2.9%
Immigrants | Burma/Myanmar
69.5
/100
|
#158
Good
2.9%