Immigrants from Nepal vs Guamanian/Chamorro Hearing Disability
COMPARE
Immigrants from Nepal
Guamanian/Chamorro
Hearing Disability
Hearing Disability Comparison
Immigrants from Nepal
Guamanians/Chamorros
2.7%
HEARING DISABILITY
98.3/ 100
METRIC RATING
65th/ 347
METRIC RANK
3.3%
HEARING DISABILITY
2.2/ 100
METRIC RATING
235th/ 347
METRIC RANK
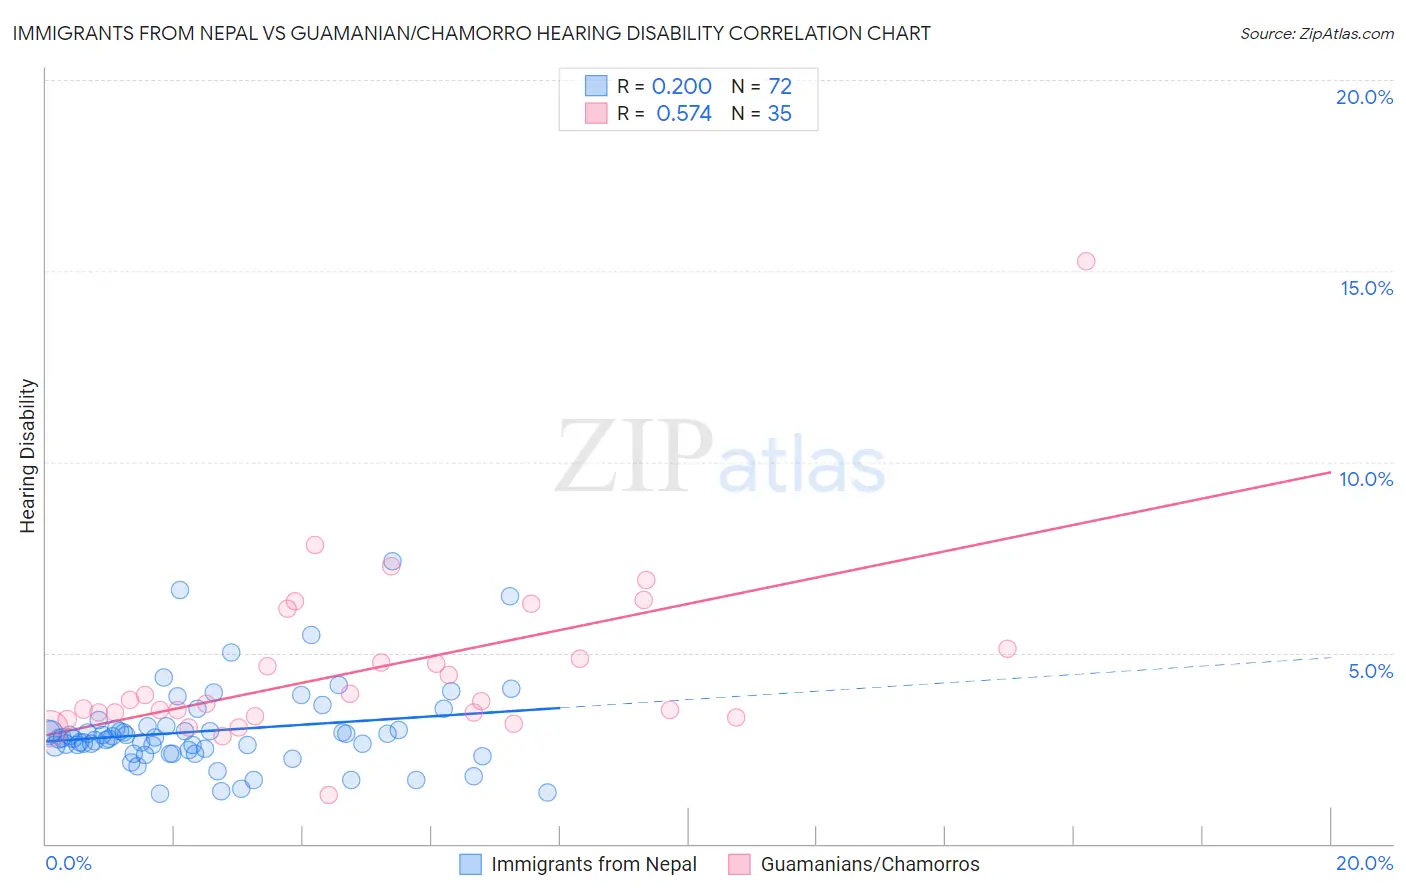
Immigrants from Nepal vs Guamanian/Chamorro Hearing Disability Correlation Chart
The statistical analysis conducted on geographies consisting of 186,754,465 people shows a weak positive correlation between the proportion of Immigrants from Nepal and percentage of population with hearing disability in the United States with a correlation coefficient (R) of 0.200 and weighted average of 2.7%. Similarly, the statistical analysis conducted on geographies consisting of 221,861,125 people shows a substantial positive correlation between the proportion of Guamanians/Chamorros and percentage of population with hearing disability in the United States with a correlation coefficient (R) of 0.574 and weighted average of 3.3%, a difference of 20.3%.
Hearing Disability Correlation Summary
| Measurement | Immigrants from Nepal | Guamanian/Chamorro |
| Minimum | 1.3% | 1.3% |
| Maximum | 7.4% | 15.2% |
| Range | 6.1% | 14.0% |
| Mean | 3.0% | 4.6% |
| Median | 2.8% | 3.7% |
| Interquartile 25% (IQ1) | 2.4% | 3.3% |
| Interquartile 75% (IQ3) | 3.0% | 5.1% |
| Interquartile Range (IQR) | 0.63% | 1.8% |
| Standard Deviation (Sample) | 1.1% | 2.4% |
| Standard Deviation (Population) | 1.1% | 2.3% |
Similar Demographics by Hearing Disability
Demographics Similar to Immigrants from Nepal by Hearing Disability
In terms of hearing disability, the demographic groups most similar to Immigrants from Nepal are Immigrants from Sri Lanka (2.7%, a difference of 0.080%), Immigrants from Belize (2.7%, a difference of 0.12%), Indian (Asian) (2.7%, a difference of 0.14%), Immigrants from Uzbekistan (2.7%, a difference of 0.19%), and Immigrants from Colombia (2.7%, a difference of 0.19%).
| Demographics | Rating | Rank | Hearing Disability |
| Immigrants | Peru | 98.6 /100 | #58 | Exceptional 2.7% |
| Immigrants | Eritrea | 98.5 /100 | #59 | Exceptional 2.7% |
| Immigrants | Egypt | 98.5 /100 | #60 | Exceptional 2.7% |
| Immigrants | Uzbekistan | 98.4 /100 | #61 | Exceptional 2.7% |
| Immigrants | Colombia | 98.4 /100 | #62 | Exceptional 2.7% |
| Indians (Asian) | 98.4 /100 | #63 | Exceptional 2.7% |
| Immigrants | Sri Lanka | 98.4 /100 | #64 | Exceptional 2.7% |
| Immigrants | Nepal | 98.3 /100 | #65 | Exceptional 2.7% |
| Immigrants | Belize | 98.2 /100 | #66 | Exceptional 2.7% |
| Egyptians | 98.1 /100 | #67 | Exceptional 2.7% |
| Immigrants | Africa | 98.0 /100 | #68 | Exceptional 2.7% |
| Nicaraguans | 97.9 /100 | #69 | Exceptional 2.7% |
| Peruvians | 97.7 /100 | #70 | Exceptional 2.7% |
| Central Americans | 97.7 /100 | #71 | Exceptional 2.7% |
| Afghans | 97.6 /100 | #72 | Exceptional 2.7% |
Demographics Similar to Guamanians/Chamorros by Hearing Disability
In terms of hearing disability, the demographic groups most similar to Guamanians/Chamorros are Serbian (3.3%, a difference of 0.060%), Central American Indian (3.3%, a difference of 0.10%), Estonian (3.3%, a difference of 0.17%), Immigrants from Austria (3.3%, a difference of 0.46%), and German Russian (3.3%, a difference of 0.46%).
| Demographics | Rating | Rank | Hearing Disability |
| Immigrants | Portugal | 4.3 /100 | #228 | Tragic 3.2% |
| Maltese | 4.1 /100 | #229 | Tragic 3.2% |
| Greeks | 3.2 /100 | #230 | Tragic 3.2% |
| Luxembourgers | 2.9 /100 | #231 | Tragic 3.2% |
| Ukrainians | 2.9 /100 | #232 | Tragic 3.2% |
| Estonians | 2.4 /100 | #233 | Tragic 3.3% |
| Central American Indians | 2.3 /100 | #234 | Tragic 3.3% |
| Guamanians/Chamorros | 2.2 /100 | #235 | Tragic 3.3% |
| Serbians | 2.2 /100 | #236 | Tragic 3.3% |
| Immigrants | Austria | 1.8 /100 | #237 | Tragic 3.3% |
| German Russians | 1.8 /100 | #238 | Tragic 3.3% |
| Nepalese | 1.2 /100 | #239 | Tragic 3.3% |
| Immigrants | Netherlands | 1.1 /100 | #240 | Tragic 3.3% |
| Samoans | 1.1 /100 | #241 | Tragic 3.3% |
| Yugoslavians | 1.0 /100 | #242 | Tragic 3.3% |