Immigrants from Mexico vs Bangladeshi Vision Disability
COMPARE
Immigrants from Mexico
Bangladeshi
Vision Disability
Vision Disability Comparison
Immigrants from Mexico
Bangladeshis
2.5%
VISION DISABILITY
0.0/ 100
METRIC RATING
296th/ 347
METRIC RANK
2.3%
VISION DISABILITY
0.5/ 100
METRIC RATING
250th/ 347
METRIC RANK
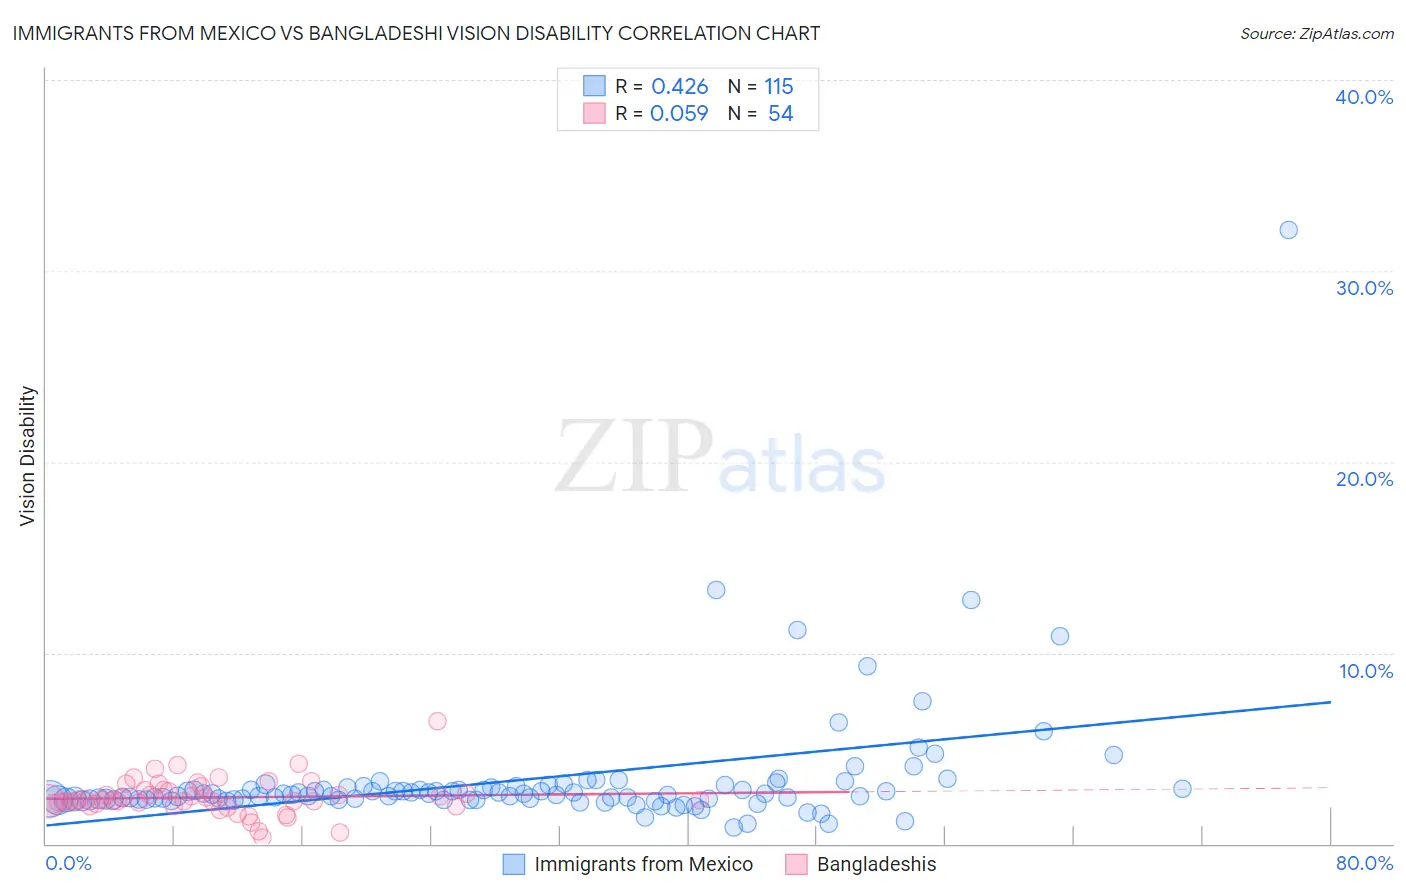
Immigrants from Mexico vs Bangladeshi Vision Disability Correlation Chart
The statistical analysis conducted on geographies consisting of 512,775,331 people shows a moderate positive correlation between the proportion of Immigrants from Mexico and percentage of population with vision disability in the United States with a correlation coefficient (R) of 0.426 and weighted average of 2.5%. Similarly, the statistical analysis conducted on geographies consisting of 141,342,048 people shows a slight positive correlation between the proportion of Bangladeshis and percentage of population with vision disability in the United States with a correlation coefficient (R) of 0.059 and weighted average of 2.3%, a difference of 6.9%.
Vision Disability Correlation Summary
| Measurement | Immigrants from Mexico | Bangladeshi |
| Minimum | 0.88% | 0.30% |
| Maximum | 32.1% | 6.4% |
| Range | 31.3% | 6.1% |
| Mean | 3.3% | 2.4% |
| Median | 2.6% | 2.3% |
| Interquartile 25% (IQ1) | 2.3% | 2.1% |
| Interquartile 75% (IQ3) | 3.0% | 2.8% |
| Interquartile Range (IQR) | 0.66% | 0.72% |
| Standard Deviation (Sample) | 3.4% | 0.96% |
| Standard Deviation (Population) | 3.4% | 0.95% |
Similar Demographics by Vision Disability
Demographics Similar to Immigrants from Mexico by Vision Disability
In terms of vision disability, the demographic groups most similar to Immigrants from Mexico are Delaware (2.5%, a difference of 0.11%), Ottawa (2.5%, a difference of 0.32%), Yaqui (2.5%, a difference of 0.66%), Crow (2.5%, a difference of 0.68%), and Immigrants from Dominica (2.5%, a difference of 0.68%).
| Demographics | Rating | Rank | Vision Disability |
| Immigrants | Nonimmigrants | 0.0 /100 | #289 | Tragic 2.5% |
| Immigrants | Cuba | 0.0 /100 | #290 | Tragic 2.5% |
| Immigrants | Honduras | 0.0 /100 | #291 | Tragic 2.5% |
| Crow | 0.0 /100 | #292 | Tragic 2.5% |
| Yaqui | 0.0 /100 | #293 | Tragic 2.5% |
| Ottawa | 0.0 /100 | #294 | Tragic 2.5% |
| Delaware | 0.0 /100 | #295 | Tragic 2.5% |
| Immigrants | Mexico | 0.0 /100 | #296 | Tragic 2.5% |
| Immigrants | Dominica | 0.0 /100 | #297 | Tragic 2.5% |
| Mexicans | 0.0 /100 | #298 | Tragic 2.5% |
| Cree | 0.0 /100 | #299 | Tragic 2.5% |
| Africans | 0.0 /100 | #300 | Tragic 2.5% |
| Menominee | 0.0 /100 | #301 | Tragic 2.5% |
| Spanish American Indians | 0.0 /100 | #302 | Tragic 2.6% |
| Immigrants | Cabo Verde | 0.0 /100 | #303 | Tragic 2.6% |
Demographics Similar to Bangladeshis by Vision Disability
In terms of vision disability, the demographic groups most similar to Bangladeshis are Liberian (2.3%, a difference of 0.080%), Subsaharan African (2.3%, a difference of 0.10%), Immigrants from Laos (2.4%, a difference of 0.11%), Guatemalan (2.3%, a difference of 0.12%), and French (2.3%, a difference of 0.15%).
| Demographics | Rating | Rank | Vision Disability |
| Immigrants | Nicaragua | 0.6 /100 | #243 | Tragic 2.3% |
| Immigrants | West Indies | 0.6 /100 | #244 | Tragic 2.3% |
| Alsatians | 0.6 /100 | #245 | Tragic 2.3% |
| French | 0.5 /100 | #246 | Tragic 2.3% |
| Guatemalans | 0.5 /100 | #247 | Tragic 2.3% |
| Sub-Saharan Africans | 0.5 /100 | #248 | Tragic 2.3% |
| Liberians | 0.5 /100 | #249 | Tragic 2.3% |
| Bangladeshis | 0.5 /100 | #250 | Tragic 2.3% |
| Immigrants | Laos | 0.4 /100 | #251 | Tragic 2.4% |
| Immigrants | Micronesia | 0.3 /100 | #252 | Tragic 2.4% |
| Japanese | 0.3 /100 | #253 | Tragic 2.4% |
| Haitians | 0.3 /100 | #254 | Tragic 2.4% |
| Immigrants | Guatemala | 0.3 /100 | #255 | Tragic 2.4% |
| Immigrants | Haiti | 0.2 /100 | #256 | Tragic 2.4% |
| West Indians | 0.2 /100 | #257 | Tragic 2.4% |