Immigrants from Italy vs Norwegian Male Disability

COMPARE

Immigrants from Italy
Race
Ancestry
AfghanAfricanAlaska NativeAlaskan AthabascanAlbanianAleutAlsatianAmericanApacheArabArapahoArgentineanArmenianAssyrian/Chaldean/SyriacAustralianAustrianBahamianBangladeshiBarbadianBasqueBelgianBelizeanBermudanBhutaneseBlackfeetBolivianBrazilianBritishBritish West IndianBulgarianBurmeseCajunCambodianCanadianCape VerdeanCarpatho RusynCelticCentral AmericanCentral American IndianCherokeeCheyenneChickasawChileanChineseChippewaChoctawColombianColvilleComancheCosta RicanCreeCreekCroatianCrowCubanCypriotCzechCzechoslovakianDanishDelawareDominicanDutchDutch West IndianEastern EuropeanEcuadorianEgyptianEnglishEstonianEthiopianEuropeanFijianFilipinoFinnishFrenchFrench American IndianFrench CanadianGermanGerman RussianGhanaianGreekGuamanian/ChamorroGuatemalanGuyaneseHaitianHmongHonduranHopiHoumaHungarianIcelanderIndian (Asian)IndonesianInupiatIranianIraqiIrishIroquoisIsraeliItalianJamaicanJapaneseJordanianKenyanKiowaKoreanLaotianLatvianLebaneseLiberianLithuanianLumbeeLuxembourgerMacedonianMalaysianMalteseMarshalleseMenomineeMexicanMexican American IndianMongolianMoroccanNative HawaiianNavajoNepaleseNew ZealanderNicaraguanNigerianNorthern EuropeanOkinawanOsageOttawaPaiutePakistaniPalestinianPanamanianParaguayanPennsylvania GermanPeruvianPimaPolishPortuguesePotawatomiPuebloPuerto RicanPuget Sound SalishRomanianRussianSalvadoranSamoanScandinavianScotch-IrishScottishSeminoleSenegaleseSerbianShoshoneSierra LeoneanSiouxSlavicSlovakSloveneSomaliSouth AfricanSouth AmericanSouth American IndianSoviet UnionSpaniardSpanishSpanish AmericanSpanish American IndianSri LankanSubsaharan AfricanSudaneseSwedishSwissSyrianTaiwaneseThaiTlingit-HaidaTohono O'OdhamTonganTrinidadian and TobagonianTsimshianTurkishU.S. Virgin IslanderUgandanUkrainianUruguayanUteVenezuelanVietnameseWelshWest IndianYakamaYaquiYugoslavianYumanYup'ikZimbabwean
Immigration
NonimmigrantsImmigrantsAfghanistanAfricaAlbaniaArgentinaArmeniaAsiaAustraliaAustriaBahamasBangladeshBarbadosBelarusBelgiumBelizeBoliviaBosnia and HerzegovinaBrazilBulgariaBurma/MyanmarCabo VerdeCambodiaCameroonCanadaCaribbeanCentral AmericaChileChinaColombiaCongoCosta RicaCroatiaCubaCzechoslovakiaDenmarkDominicaDominican RepublicEastern AfricaEastern AsiaEastern EuropeEcuadorEgyptEl SalvadorEnglandEritreaEthiopiaEuropeFijiFranceGermanyGhanaGreeceGrenadaGuatemalaGuyanaHaitiHondurasHong KongHungaryIndiaIndonesiaIranIraqIrelandIsraelItalyJamaicaJapanJordanKazakhstanKenyaKoreaKuwaitLaosLatin AmericaLatviaLebanonLiberiaLithuaniaMalaysiaMexicoMicronesiaMiddle AfricaMoldovaMoroccoNepalNetherlandsNicaraguaNigeriaNorth AmericaNorth MacedoniaNorthern AfricaNorthern EuropeNorwayOceaniaPakistanPanamaPeruPhilippinesPolandPortugalRomaniaRussiaSaudi ArabiaScotlandSenegalSerbiaSierra LeoneSingaporeSomaliaSouth AfricaSouth AmericaSouth Central AsiaSouth Eastern AsiaSouthern EuropeSpainSri LankaSt. Vincent and the GrenadinesSudanSwedenSwitzerlandSyriaTaiwanThailandTrinidad and TobagoTurkeyUgandaUkraineUruguayUzbekistanVenezuelaVietnamWest IndiesWestern AfricaWestern AsiaWestern EuropeYemenZaireZimbabweAzores
Norwegian
Race
Ancestry
AfghanAfricanAlaska NativeAlaskan AthabascanAlbanianAleutAlsatianAmericanApacheArabArapahoArgentineanArmenianAssyrian/Chaldean/SyriacAustralianAustrianBahamianBangladeshiBarbadianBasqueBelgianBelizeanBermudanBhutaneseBlackfeetBolivianBrazilianBritishBritish West IndianBulgarianBurmeseCajunCambodianCanadianCape VerdeanCarpatho RusynCelticCentral AmericanCentral American IndianCherokeeCheyenneChickasawChileanChineseChippewaChoctawColombianColvilleComancheCosta RicanCreeCreekCroatianCrowCubanCypriotCzechCzechoslovakianDanishDelawareDominicanDutchDutch West IndianEastern EuropeanEcuadorianEgyptianEnglishEstonianEthiopianEuropeanFijianFilipinoFinnishFrenchFrench American IndianFrench CanadianGermanGerman RussianGhanaianGreekGuamanian/ChamorroGuatemalanGuyaneseHaitianHmongHonduranHopiHoumaHungarianIcelanderIndian (Asian)IndonesianInupiatIranianIraqiIrishIroquoisIsraeliItalianJamaicanJapaneseJordanianKenyanKiowaKoreanLaotianLatvianLebaneseLiberianLithuanianLumbeeLuxembourgerMacedonianMalaysianMalteseMarshalleseMenomineeMexicanMexican American IndianMongolianMoroccanNative HawaiianNavajoNepaleseNew ZealanderNicaraguanNigerianNorthern EuropeanNorwegianOkinawanOsageOttawaPaiutePakistaniPalestinianPanamanianParaguayanPennsylvania GermanPeruvianPimaPolishPortuguesePotawatomiPuebloPuerto RicanPuget Sound SalishRomanianRussianSalvadoranSamoanScandinavianScotch-IrishScottishSeminoleSenegaleseSerbianShoshoneSierra LeoneanSiouxSlavicSlovakSloveneSomaliSouth AfricanSouth AmericanSouth American IndianSoviet UnionSpaniardSpanishSpanish AmericanSpanish American IndianSri LankanSubsaharan AfricanSudaneseSwedishSwissSyrianTaiwaneseThaiTlingit-HaidaTohono O'OdhamTonganTrinidadian and TobagonianTsimshianTurkishU.S. Virgin IslanderUgandanUkrainianUruguayanUteVenezuelanVietnameseWelshWest IndianYakamaYaquiYugoslavianYumanYup'ikZimbabwean
Immigration
NonimmigrantsImmigrantsAfghanistanAfricaAlbaniaArgentinaArmeniaAsiaAustraliaAustriaBahamasBangladeshBarbadosBelarusBelgiumBelizeBoliviaBosnia and HerzegovinaBrazilBulgariaBurma/MyanmarCabo VerdeCambodiaCameroonCanadaCaribbeanCentral AmericaChileChinaColombiaCongoCosta RicaCroatiaCubaCzechoslovakiaDenmarkDominicaDominican RepublicEastern AfricaEastern AsiaEastern EuropeEcuadorEgyptEl SalvadorEnglandEritreaEthiopiaEuropeFijiFranceGermanyGhanaGreeceGrenadaGuatemalaGuyanaHaitiHondurasHong KongHungaryIndiaIndonesiaIranIraqIrelandIsraelJamaicaJapanJordanKazakhstanKenyaKoreaKuwaitLaosLatin AmericaLatviaLebanonLiberiaLithuaniaMalaysiaMexicoMicronesiaMiddle AfricaMoldovaMoroccoNepalNetherlandsNicaraguaNigeriaNorth AmericaNorth MacedoniaNorthern AfricaNorthern EuropeNorwayOceaniaPakistanPanamaPeruPhilippinesPolandPortugalRomaniaRussiaSaudi ArabiaScotlandSenegalSerbiaSierra LeoneSingaporeSomaliaSouth AfricaSouth AmericaSouth Central AsiaSouth Eastern AsiaSouthern EuropeSpainSri LankaSt. Vincent and the GrenadinesSudanSwedenSwitzerlandSyriaTaiwanThailandTrinidad and TobagoTurkeyUgandaUkraineUruguayUzbekistanVenezuelaVietnamWest IndiesWestern AfricaWestern AsiaWestern EuropeYemenZaireZimbabweAzores
Male Disability
Income
Poverty
Unemployment
Labor Participation
Family Structure
Vehicle Availability
Education Level
Disability

Male Disability Comparison

Immigrants from Italy

Norwegians

Excellent
Tragic
11.0%
MALE DISABILITY
81.5/ 100
METRIC RATING
140th/ 347
METRIC RANK
12.2%
MALE DISABILITY
0.2/ 100
METRIC RATING
262nd/ 347
METRIC RANK

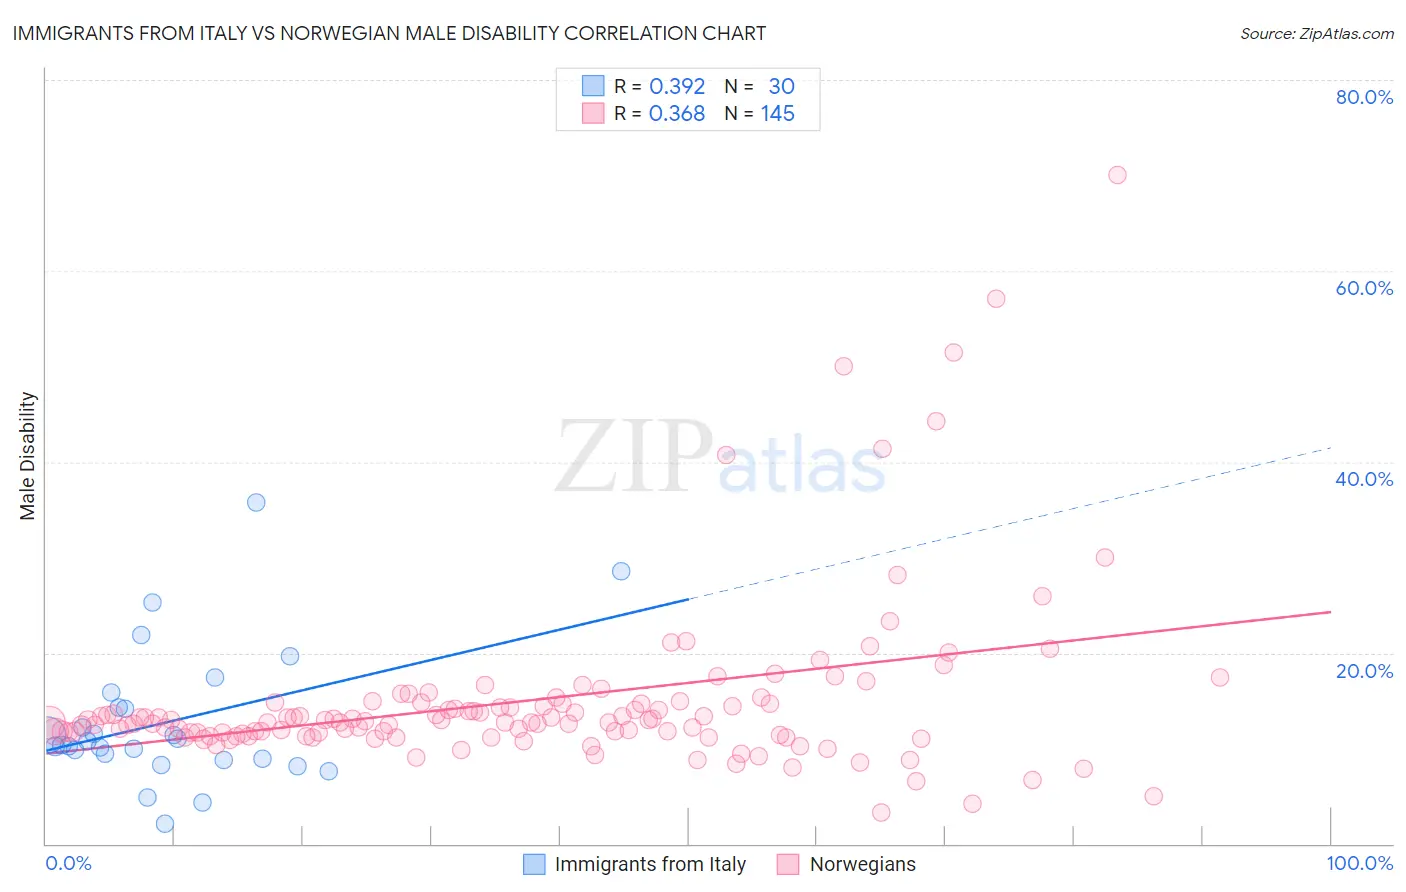
Immigrants from Italy vs Norwegian Male Disability Correlation Chart

The statistical analysis conducted on geographies consisting of 324,211,861 people shows a mild positive correlation between the proportion of Immigrants from Italy and percentage of males with a disability in the United States with a correlation coefficient (R) of 0.392 and weighted average of 11.0%. Similarly, the statistical analysis conducted on geographies consisting of 533,169,382 people shows a mild positive correlation between the proportion of Norwegians and percentage of males with a disability in the United States with a correlation coefficient (R) of 0.368 and weighted average of 12.2%, a difference of 10.8%.
Immigrants from Italy vs Norwegian Male Disability

Male Disability Correlation Summary

MeasurementImmigrants from ItalyNorwegian
Minimum2.1%3.3%
Maximum35.7%70.0%
Range33.6%66.7%
Mean12.8%15.0%
Median10.5%12.8%
Interquartile 25% (IQ1)8.9%11.5%
Interquartile 75% (IQ3)14.3%14.7%
Interquartile Range (IQR)5.4%3.2%
Standard Deviation (Sample)7.2%9.1%
Standard Deviation (Population)7.1%9.1%

Similar Demographics by Male Disability

Demographics Similar to Immigrants from Italy by Male Disability

In terms of male disability, the demographic groups most similar to Immigrants from Italy are Arab (11.0%, a difference of 0.0%), Immigrants from Sudan (11.0%, a difference of 0.0%), South African (11.0%, a difference of 0.020%), Nigerian (11.0%, a difference of 0.030%), and Immigrants from Europe (11.0%, a difference of 0.040%).
DemographicsRating | RankMale Disability
Ugandans
83.9
/100
|
#133
Excellent
11.0%
Bhutanese
83.4
/100
|
#134
Excellent
11.0%
Trinidadians and Tobagonians
83.3
/100
|
#135
Excellent
11.0%
Immigrants | Costa Rica
82.8
/100
|
#136
Excellent
11.0%
Immigrants | Europe
82.0
/100
|
#137
Excellent
11.0%
Nigerians
81.9
/100
|
#138
Excellent
11.0%
South Africans
81.7
/100
|
#139
Excellent
11.0%
Immigrants | Italy
81.5
/100
|
#140
Excellent
11.0%
Arabs
81.5
/100
|
#141
Excellent
11.0%
Immigrants | Sudan
81.5
/100
|
#142
Excellent
11.0%
Moroccans
80.7
/100
|
#143
Excellent
11.0%
Kenyans
78.1
/100
|
#144
Good
11.0%
Costa Ricans
78.0
/100
|
#145
Good
11.0%
Koreans
77.5
/100
|
#146
Good
11.0%
Immigrants | Croatia
77.3
/100
|
#147
Good
11.0%

Demographics Similar to Norwegians by Male Disability

In terms of male disability, the demographic groups most similar to Norwegians are Slavic (12.2%, a difference of 0.010%), Canadian (12.2%, a difference of 0.20%), Nepalese (12.2%, a difference of 0.23%), Swedish (12.1%, a difference of 0.37%), and Belgian (12.1%, a difference of 0.44%).
DemographicsRating | RankMale Disability
Chinese
0.4
/100
|
#255
Tragic
12.1%
Swiss
0.3
/100
|
#256
Tragic
12.1%
Europeans
0.3
/100
|
#257
Tragic
12.1%
Basques
0.3
/100
|
#258
Tragic
12.1%
Belgians
0.3
/100
|
#259
Tragic
12.1%
Swedes
0.3
/100
|
#260
Tragic
12.1%
Slavs
0.2
/100
|
#261
Tragic
12.2%
Norwegians
0.2
/100
|
#262
Tragic
12.2%
Canadians
0.2
/100
|
#263
Tragic
12.2%
Nepalese
0.2
/100
|
#264
Tragic
12.2%
Immigrants | Portugal
0.1
/100
|
#265
Tragic
12.3%
Hawaiians
0.1
/100
|
#266
Tragic
12.3%
Immigrants | Germany
0.1
/100
|
#267
Tragic
12.3%
Portuguese
0.1
/100
|
#268
Tragic
12.3%
Czechoslovakians
0.1
/100
|
#269
Tragic
12.3%