Immigrants from Israel vs Immigrants from Serbia Disability Age 35 to 64

COMPARE

Immigrants from Israel
Race
Ancestry
AfghanAfricanAlaska NativeAlaskan AthabascanAlbanianAleutAlsatianAmericanApacheArabArapahoArgentineanArmenianAssyrian/Chaldean/SyriacAustralianAustrianBahamianBangladeshiBarbadianBasqueBelgianBelizeanBermudanBhutaneseBlackfeetBolivianBrazilianBritishBritish West IndianBulgarianBurmeseCajunCambodianCanadianCape VerdeanCarpatho RusynCelticCentral AmericanCentral American IndianCherokeeCheyenneChickasawChileanChineseChippewaChoctawColombianColvilleComancheCosta RicanCreeCreekCroatianCrowCubanCypriotCzechCzechoslovakianDanishDelawareDominicanDutchDutch West IndianEastern EuropeanEcuadorianEgyptianEnglishEstonianEthiopianEuropeanFijianFilipinoFinnishFrenchFrench American IndianFrench CanadianGermanGerman RussianGhanaianGreekGuamanian/ChamorroGuatemalanGuyaneseHaitianHmongHonduranHopiHoumaHungarianIcelanderIndian (Asian)IndonesianInupiatIranianIraqiIrishIroquoisIsraeliItalianJamaicanJapaneseJordanianKenyanKiowaKoreanLaotianLatvianLebaneseLiberianLithuanianLumbeeLuxembourgerMacedonianMalaysianMalteseMarshalleseMenomineeMexicanMexican American IndianMongolianMoroccanNative HawaiianNavajoNepaleseNew ZealanderNicaraguanNigerianNorthern EuropeanNorwegianOkinawanOsageOttawaPaiutePakistaniPalestinianPanamanianParaguayanPennsylvania GermanPeruvianPimaPolishPortuguesePotawatomiPuebloPuerto RicanPuget Sound SalishRomanianRussianSalvadoranSamoanScandinavianScotch-IrishScottishSeminoleSenegaleseSerbianShoshoneSierra LeoneanSiouxSlavicSlovakSloveneSomaliSouth AfricanSouth AmericanSouth American IndianSoviet UnionSpaniardSpanishSpanish AmericanSpanish American IndianSri LankanSubsaharan AfricanSudaneseSwedishSwissSyrianTaiwaneseThaiTlingit-HaidaTohono O'OdhamTonganTrinidadian and TobagonianTsimshianTurkishU.S. Virgin IslanderUgandanUkrainianUruguayanUteVenezuelanVietnameseWelshWest IndianYakamaYaquiYugoslavianYumanYup'ikZimbabwean
Immigration
NonimmigrantsImmigrantsAfghanistanAfricaAlbaniaArgentinaArmeniaAsiaAustraliaAustriaBahamasBangladeshBarbadosBelarusBelgiumBelizeBoliviaBosnia and HerzegovinaBrazilBulgariaBurma/MyanmarCabo VerdeCambodiaCameroonCanadaCaribbeanCentral AmericaChileChinaColombiaCongoCosta RicaCroatiaCubaCzechoslovakiaDenmarkDominicaDominican RepublicEastern AfricaEastern AsiaEastern EuropeEcuadorEgyptEl SalvadorEnglandEritreaEthiopiaEuropeFijiFranceGermanyGhanaGreeceGrenadaGuatemalaGuyanaHaitiHondurasHong KongHungaryIndiaIndonesiaIranIraqIrelandIsraelItalyJamaicaJapanJordanKazakhstanKenyaKoreaKuwaitLaosLatin AmericaLatviaLebanonLiberiaLithuaniaMalaysiaMexicoMicronesiaMiddle AfricaMoldovaMoroccoNepalNetherlandsNicaraguaNigeriaNorth AmericaNorth MacedoniaNorthern AfricaNorthern EuropeNorwayOceaniaPakistanPanamaPeruPhilippinesPolandPortugalRomaniaRussiaSaudi ArabiaScotlandSenegalSierra LeoneSingaporeSomaliaSouth AfricaSouth AmericaSouth Central AsiaSouth Eastern AsiaSouthern EuropeSpainSri LankaSt. Vincent and the GrenadinesSudanSwedenSwitzerlandSyriaTaiwanThailandTrinidad and TobagoTurkeyUgandaUkraineUruguayUzbekistanVenezuelaVietnamWest IndiesWestern AfricaWestern AsiaWestern EuropeYemenZaireZimbabweAzores
Immigrants from Serbia
Race
Ancestry
AfghanAfricanAlaska NativeAlaskan AthabascanAlbanianAleutAlsatianAmericanApacheArabArapahoArgentineanArmenianAssyrian/Chaldean/SyriacAustralianAustrianBahamianBangladeshiBarbadianBasqueBelgianBelizeanBermudanBhutaneseBlackfeetBolivianBrazilianBritishBritish West IndianBulgarianBurmeseCajunCambodianCanadianCape VerdeanCarpatho RusynCelticCentral AmericanCentral American IndianCherokeeCheyenneChickasawChileanChineseChippewaChoctawColombianColvilleComancheCosta RicanCreeCreekCroatianCrowCubanCypriotCzechCzechoslovakianDanishDelawareDominicanDutchDutch West IndianEastern EuropeanEcuadorianEgyptianEnglishEstonianEthiopianEuropeanFijianFilipinoFinnishFrenchFrench American IndianFrench CanadianGermanGerman RussianGhanaianGreekGuamanian/ChamorroGuatemalanGuyaneseHaitianHmongHonduranHopiHoumaHungarianIcelanderIndian (Asian)IndonesianInupiatIranianIraqiIrishIroquoisIsraeliItalianJamaicanJapaneseJordanianKenyanKiowaKoreanLaotianLatvianLebaneseLiberianLithuanianLumbeeLuxembourgerMacedonianMalaysianMalteseMarshalleseMenomineeMexicanMexican American IndianMongolianMoroccanNative HawaiianNavajoNepaleseNew ZealanderNicaraguanNigerianNorthern EuropeanNorwegianOkinawanOsageOttawaPaiutePakistaniPalestinianPanamanianParaguayanPennsylvania GermanPeruvianPimaPolishPortuguesePotawatomiPuebloPuerto RicanPuget Sound SalishRomanianRussianSalvadoranSamoanScandinavianScotch-IrishScottishSeminoleSenegaleseSerbianShoshoneSierra LeoneanSiouxSlavicSlovakSloveneSomaliSouth AfricanSouth AmericanSouth American IndianSoviet UnionSpaniardSpanishSpanish AmericanSpanish American IndianSri LankanSubsaharan AfricanSudaneseSwedishSwissSyrianTaiwaneseThaiTlingit-HaidaTohono O'OdhamTonganTrinidadian and TobagonianTsimshianTurkishU.S. Virgin IslanderUgandanUkrainianUruguayanUteVenezuelanVietnameseWelshWest IndianYakamaYaquiYugoslavianYumanYup'ikZimbabwean
Immigration
NonimmigrantsImmigrantsAfghanistanAfricaAlbaniaArgentinaArmeniaAsiaAustraliaAustriaBahamasBangladeshBarbadosBelarusBelgiumBelizeBoliviaBosnia and HerzegovinaBrazilBulgariaBurma/MyanmarCabo VerdeCambodiaCameroonCanadaCaribbeanCentral AmericaChileChinaColombiaCongoCosta RicaCroatiaCubaCzechoslovakiaDenmarkDominicaDominican RepublicEastern AfricaEastern AsiaEastern EuropeEcuadorEgyptEl SalvadorEnglandEritreaEthiopiaEuropeFijiFranceGermanyGhanaGreeceGrenadaGuatemalaGuyanaHaitiHondurasHong KongHungaryIndiaIndonesiaIranIraqIrelandItalyJamaicaJapanJordanKazakhstanKenyaKoreaKuwaitLaosLatin AmericaLatviaLebanonLiberiaLithuaniaMalaysiaMexicoMicronesiaMiddle AfricaMoldovaMoroccoNepalNetherlandsNicaraguaNigeriaNorth AmericaNorth MacedoniaNorthern AfricaNorthern EuropeNorwayOceaniaPakistanPanamaPeruPhilippinesPolandPortugalRomaniaRussiaSaudi ArabiaScotlandSenegalSerbiaSierra LeoneSingaporeSomaliaSouth AfricaSouth AmericaSouth Central AsiaSouth Eastern AsiaSouthern EuropeSpainSri LankaSt. Vincent and the GrenadinesSudanSwedenSwitzerlandSyriaTaiwanThailandTrinidad and TobagoTurkeyUgandaUkraineUruguayUzbekistanVenezuelaVietnamWest IndiesWestern AfricaWestern AsiaWestern EuropeYemenZaireZimbabweAzores
Disability Age 35 to 64
Income
Poverty
Unemployment
Labor Participation
Family Structure
Vehicle Availability
Education Level
Disability

Disability Age 35 to 64 Comparison

Immigrants from Israel

Immigrants from Serbia

Exceptional
Exceptional
8.6%
DISABILITY AGE 35 TO 64
100.0/ 100
METRIC RATING
7th/ 347
METRIC RANK
9.8%
DISABILITY AGE 35 TO 64
99.8/ 100
METRIC RATING
48th/ 347
METRIC RANK

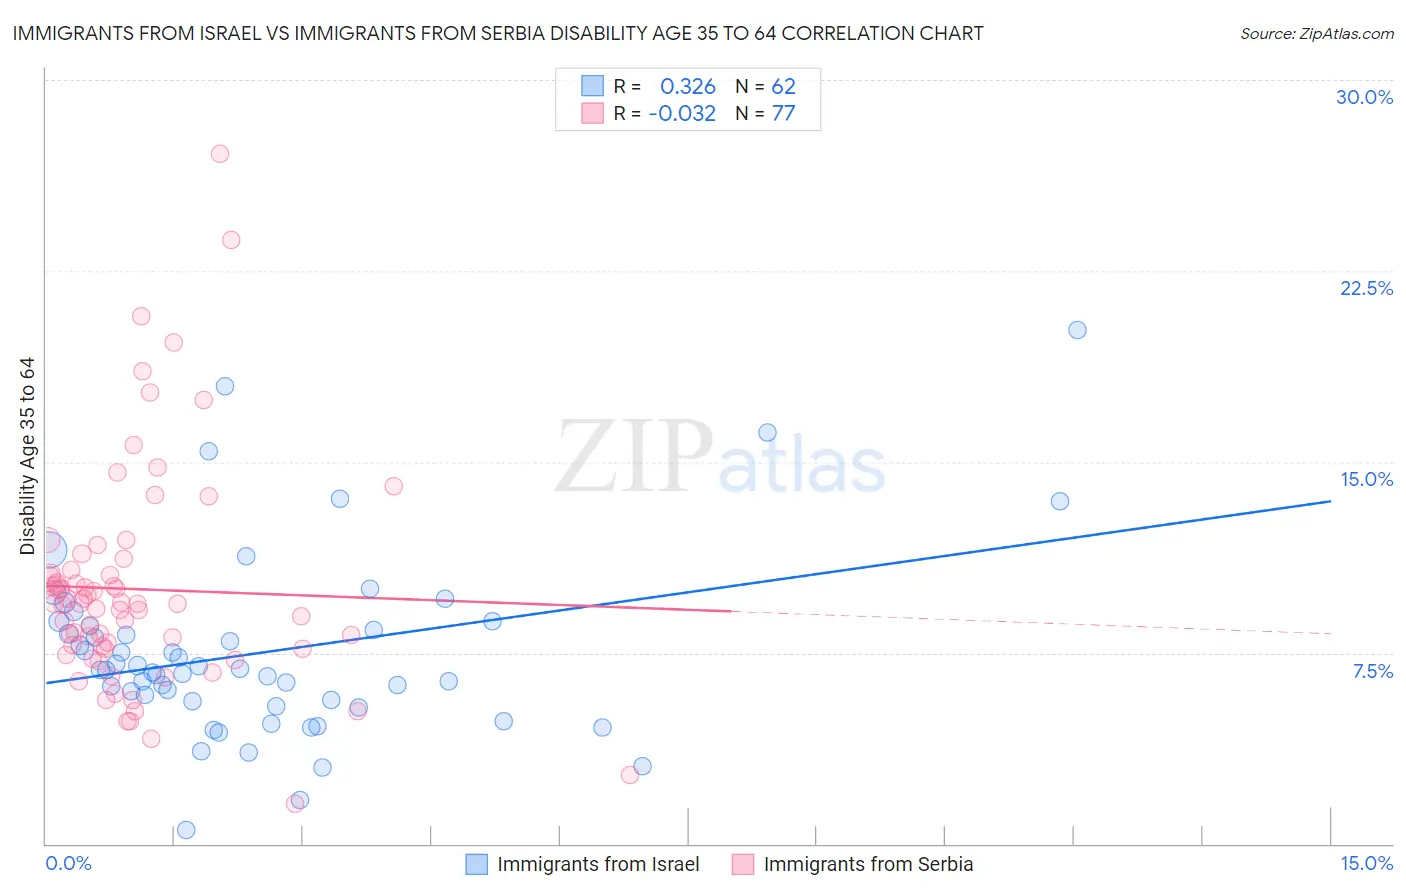
Immigrants from Israel vs Immigrants from Serbia Disability Age 35 to 64 Correlation Chart

The statistical analysis conducted on geographies consisting of 209,961,386 people shows a mild positive correlation between the proportion of Immigrants from Israel and percentage of population with a disability between the ages 34 and 64 in the United States with a correlation coefficient (R) of 0.326 and weighted average of 8.6%. Similarly, the statistical analysis conducted on geographies consisting of 131,722,844 people shows no correlation between the proportion of Immigrants from Serbia and percentage of population with a disability between the ages 34 and 64 in the United States with a correlation coefficient (R) of -0.032 and weighted average of 9.8%, a difference of 14.0%.
Immigrants from Israel vs Immigrants from Serbia Disability Age 35 to 64

Disability Age 35 to 64 Correlation Summary

MeasurementImmigrants from IsraelImmigrants from Serbia
Minimum0.52%1.6%
Maximum20.2%27.1%
Range19.7%25.5%
Mean7.5%10.0%
Median6.8%9.4%
Interquartile 25% (IQ1)5.6%7.7%
Interquartile 75% (IQ3)8.5%10.7%
Interquartile Range (IQR)2.9%3.0%
Standard Deviation (Sample)3.6%4.4%
Standard Deviation (Population)3.6%4.4%

Similar Demographics by Disability Age 35 to 64

Demographics Similar to Immigrants from Israel by Disability Age 35 to 64

In terms of disability age 35 to 64, the demographic groups most similar to Immigrants from Israel are Thai (8.6%, a difference of 0.42%), Iranian (8.7%, a difference of 0.58%), Immigrants from China (8.7%, a difference of 1.0%), Immigrants from Bolivia (8.7%, a difference of 1.3%), and Immigrants from Iran (8.5%, a difference of 1.4%).
DemographicsRating | RankDisability Age 35 to 64
Immigrants | Taiwan
100.0
/100
|
#1
Exceptional
7.8%
Filipinos
100.0
/100
|
#2
Exceptional
8.0%
Immigrants | Hong Kong
100.0
/100
|
#3
Exceptional
8.2%
Immigrants | India
100.0
/100
|
#4
Exceptional
8.3%
Immigrants | Iran
100.0
/100
|
#5
Exceptional
8.5%
Thais
100.0
/100
|
#6
Exceptional
8.6%
Immigrants | Israel
100.0
/100
|
#7
Exceptional
8.6%
Iranians
100.0
/100
|
#8
Exceptional
8.7%
Immigrants | China
100.0
/100
|
#9
Exceptional
8.7%
Immigrants | Bolivia
100.0
/100
|
#10
Exceptional
8.7%
Immigrants | Eastern Asia
100.0
/100
|
#11
Exceptional
8.8%
Indians (Asian)
100.0
/100
|
#12
Exceptional
8.9%
Immigrants | South Central Asia
100.0
/100
|
#13
Exceptional
8.9%
Immigrants | Singapore
100.0
/100
|
#14
Exceptional
8.9%
Bolivians
100.0
/100
|
#15
Exceptional
8.9%

Demographics Similar to Immigrants from Serbia by Disability Age 35 to 64

In terms of disability age 35 to 64, the demographic groups most similar to Immigrants from Serbia are Immigrants from Belgium (9.8%, a difference of 0.010%), Immigrants from Greece (9.8%, a difference of 0.040%), Cambodian (9.8%, a difference of 0.060%), Paraguayan (9.8%, a difference of 0.11%), and Bhutanese (9.8%, a difference of 0.20%).
DemographicsRating | RankDisability Age 35 to 64
Israelis
99.9
/100
|
#41
Exceptional
9.7%
Immigrants | Malaysia
99.9
/100
|
#42
Exceptional
9.7%
Immigrants | Colombia
99.9
/100
|
#43
Exceptional
9.8%
Immigrants | Egypt
99.9
/100
|
#44
Exceptional
9.8%
Immigrants | Peru
99.9
/100
|
#45
Exceptional
9.8%
Cambodians
99.8
/100
|
#46
Exceptional
9.8%
Immigrants | Belgium
99.8
/100
|
#47
Exceptional
9.8%
Immigrants | Serbia
99.8
/100
|
#48
Exceptional
9.8%
Immigrants | Greece
99.8
/100
|
#49
Exceptional
9.8%
Paraguayans
99.8
/100
|
#50
Exceptional
9.8%
Bhutanese
99.8
/100
|
#51
Exceptional
9.8%
Immigrants | Bulgaria
99.8
/100
|
#52
Exceptional
9.8%
Taiwanese
99.8
/100
|
#53
Exceptional
9.8%
Immigrants | Russia
99.8
/100
|
#54
Exceptional
9.8%
Peruvians
99.8
/100
|
#55
Exceptional
9.9%