Immigrants from Israel vs Immigrants from Panama Disability Age 35 to 64

COMPARE

Immigrants from Israel
Race
Ancestry
AfghanAfricanAlaska NativeAlaskan AthabascanAlbanianAleutAlsatianAmericanApacheArabArapahoArgentineanArmenianAssyrian/Chaldean/SyriacAustralianAustrianBahamianBangladeshiBarbadianBasqueBelgianBelizeanBermudanBhutaneseBlackfeetBolivianBrazilianBritishBritish West IndianBulgarianBurmeseCajunCambodianCanadianCape VerdeanCarpatho RusynCelticCentral AmericanCentral American IndianCherokeeCheyenneChickasawChileanChineseChippewaChoctawColombianColvilleComancheCosta RicanCreeCreekCroatianCrowCubanCypriotCzechCzechoslovakianDanishDelawareDominicanDutchDutch West IndianEastern EuropeanEcuadorianEgyptianEnglishEstonianEthiopianEuropeanFijianFilipinoFinnishFrenchFrench American IndianFrench CanadianGermanGerman RussianGhanaianGreekGuamanian/ChamorroGuatemalanGuyaneseHaitianHmongHonduranHopiHoumaHungarianIcelanderIndian (Asian)IndonesianInupiatIranianIraqiIrishIroquoisIsraeliItalianJamaicanJapaneseJordanianKenyanKiowaKoreanLaotianLatvianLebaneseLiberianLithuanianLumbeeLuxembourgerMacedonianMalaysianMalteseMarshalleseMenomineeMexicanMexican American IndianMongolianMoroccanNative HawaiianNavajoNepaleseNew ZealanderNicaraguanNigerianNorthern EuropeanNorwegianOkinawanOsageOttawaPaiutePakistaniPalestinianPanamanianParaguayanPennsylvania GermanPeruvianPimaPolishPortuguesePotawatomiPuebloPuerto RicanPuget Sound SalishRomanianRussianSalvadoranSamoanScandinavianScotch-IrishScottishSeminoleSenegaleseSerbianShoshoneSierra LeoneanSiouxSlavicSlovakSloveneSomaliSouth AfricanSouth AmericanSouth American IndianSoviet UnionSpaniardSpanishSpanish AmericanSpanish American IndianSri LankanSubsaharan AfricanSudaneseSwedishSwissSyrianTaiwaneseThaiTlingit-HaidaTohono O'OdhamTonganTrinidadian and TobagonianTsimshianTurkishU.S. Virgin IslanderUgandanUkrainianUruguayanUteVenezuelanVietnameseWelshWest IndianYakamaYaquiYugoslavianYumanYup'ikZimbabwean
Immigration
NonimmigrantsImmigrantsAfghanistanAfricaAlbaniaArgentinaArmeniaAsiaAustraliaAustriaBahamasBangladeshBarbadosBelarusBelgiumBelizeBoliviaBosnia and HerzegovinaBrazilBulgariaBurma/MyanmarCabo VerdeCambodiaCameroonCanadaCaribbeanCentral AmericaChileChinaColombiaCongoCosta RicaCroatiaCubaCzechoslovakiaDenmarkDominicaDominican RepublicEastern AfricaEastern AsiaEastern EuropeEcuadorEgyptEl SalvadorEnglandEritreaEthiopiaEuropeFijiFranceGermanyGhanaGreeceGrenadaGuatemalaGuyanaHaitiHondurasHong KongHungaryIndiaIndonesiaIranIraqIrelandIsraelItalyJamaicaJapanJordanKazakhstanKenyaKoreaKuwaitLaosLatin AmericaLatviaLebanonLiberiaLithuaniaMalaysiaMexicoMicronesiaMiddle AfricaMoldovaMoroccoNepalNetherlandsNicaraguaNigeriaNorth AmericaNorth MacedoniaNorthern AfricaNorthern EuropeNorwayOceaniaPakistanPeruPhilippinesPolandPortugalRomaniaRussiaSaudi ArabiaScotlandSenegalSerbiaSierra LeoneSingaporeSomaliaSouth AfricaSouth AmericaSouth Central AsiaSouth Eastern AsiaSouthern EuropeSpainSri LankaSt. Vincent and the GrenadinesSudanSwedenSwitzerlandSyriaTaiwanThailandTrinidad and TobagoTurkeyUgandaUkraineUruguayUzbekistanVenezuelaVietnamWest IndiesWestern AfricaWestern AsiaWestern EuropeYemenZaireZimbabweAzores
Immigrants from Panama
Race
Ancestry
AfghanAfricanAlaska NativeAlaskan AthabascanAlbanianAleutAlsatianAmericanApacheArabArapahoArgentineanArmenianAssyrian/Chaldean/SyriacAustralianAustrianBahamianBangladeshiBarbadianBasqueBelgianBelizeanBermudanBhutaneseBlackfeetBolivianBrazilianBritishBritish West IndianBulgarianBurmeseCajunCambodianCanadianCape VerdeanCarpatho RusynCelticCentral AmericanCentral American IndianCherokeeCheyenneChickasawChileanChineseChippewaChoctawColombianColvilleComancheCosta RicanCreeCreekCroatianCrowCubanCypriotCzechCzechoslovakianDanishDelawareDominicanDutchDutch West IndianEastern EuropeanEcuadorianEgyptianEnglishEstonianEthiopianEuropeanFijianFilipinoFinnishFrenchFrench American IndianFrench CanadianGermanGerman RussianGhanaianGreekGuamanian/ChamorroGuatemalanGuyaneseHaitianHmongHonduranHopiHoumaHungarianIcelanderIndian (Asian)IndonesianInupiatIranianIraqiIrishIroquoisIsraeliItalianJamaicanJapaneseJordanianKenyanKiowaKoreanLaotianLatvianLebaneseLiberianLithuanianLumbeeLuxembourgerMacedonianMalaysianMalteseMarshalleseMenomineeMexicanMexican American IndianMongolianMoroccanNative HawaiianNavajoNepaleseNew ZealanderNicaraguanNigerianNorthern EuropeanNorwegianOkinawanOsageOttawaPaiutePakistaniPalestinianPanamanianParaguayanPennsylvania GermanPeruvianPimaPolishPortuguesePotawatomiPuebloPuerto RicanPuget Sound SalishRomanianRussianSalvadoranSamoanScandinavianScotch-IrishScottishSeminoleSenegaleseSerbianShoshoneSierra LeoneanSiouxSlavicSlovakSloveneSomaliSouth AfricanSouth AmericanSouth American IndianSoviet UnionSpaniardSpanishSpanish AmericanSpanish American IndianSri LankanSubsaharan AfricanSudaneseSwedishSwissSyrianTaiwaneseThaiTlingit-HaidaTohono O'OdhamTonganTrinidadian and TobagonianTsimshianTurkishU.S. Virgin IslanderUgandanUkrainianUruguayanUteVenezuelanVietnameseWelshWest IndianYakamaYaquiYugoslavianYumanYup'ikZimbabwean
Immigration
NonimmigrantsImmigrantsAfghanistanAfricaAlbaniaArgentinaArmeniaAsiaAustraliaAustriaBahamasBangladeshBarbadosBelarusBelgiumBelizeBoliviaBosnia and HerzegovinaBrazilBulgariaBurma/MyanmarCabo VerdeCambodiaCameroonCanadaCaribbeanCentral AmericaChileChinaColombiaCongoCosta RicaCroatiaCubaCzechoslovakiaDenmarkDominicaDominican RepublicEastern AfricaEastern AsiaEastern EuropeEcuadorEgyptEl SalvadorEnglandEritreaEthiopiaEuropeFijiFranceGermanyGhanaGreeceGrenadaGuatemalaGuyanaHaitiHondurasHong KongHungaryIndiaIndonesiaIranIraqIrelandItalyJamaicaJapanJordanKazakhstanKenyaKoreaKuwaitLaosLatin AmericaLatviaLebanonLiberiaLithuaniaMalaysiaMexicoMicronesiaMiddle AfricaMoldovaMoroccoNepalNetherlandsNicaraguaNigeriaNorth AmericaNorth MacedoniaNorthern AfricaNorthern EuropeNorwayOceaniaPakistanPanamaPeruPhilippinesPolandPortugalRomaniaRussiaSaudi ArabiaScotlandSenegalSerbiaSierra LeoneSingaporeSomaliaSouth AfricaSouth AmericaSouth Central AsiaSouth Eastern AsiaSouthern EuropeSpainSri LankaSt. Vincent and the GrenadinesSudanSwedenSwitzerlandSyriaTaiwanThailandTrinidad and TobagoTurkeyUgandaUkraineUruguayUzbekistanVenezuelaVietnamWest IndiesWestern AfricaWestern AsiaWestern EuropeYemenZaireZimbabweAzores
Disability Age 35 to 64
Income
Poverty
Unemployment
Labor Participation
Family Structure
Vehicle Availability
Education Level
Disability

Disability Age 35 to 64 Comparison

Immigrants from Israel

Immigrants from Panama

Exceptional
Fair
8.6%
DISABILITY AGE 35 TO 64
100.0/ 100
METRIC RATING
7th/ 347
METRIC RANK
11.6%
DISABILITY AGE 35 TO 64
20.4/ 100
METRIC RATING
198th/ 347
METRIC RANK

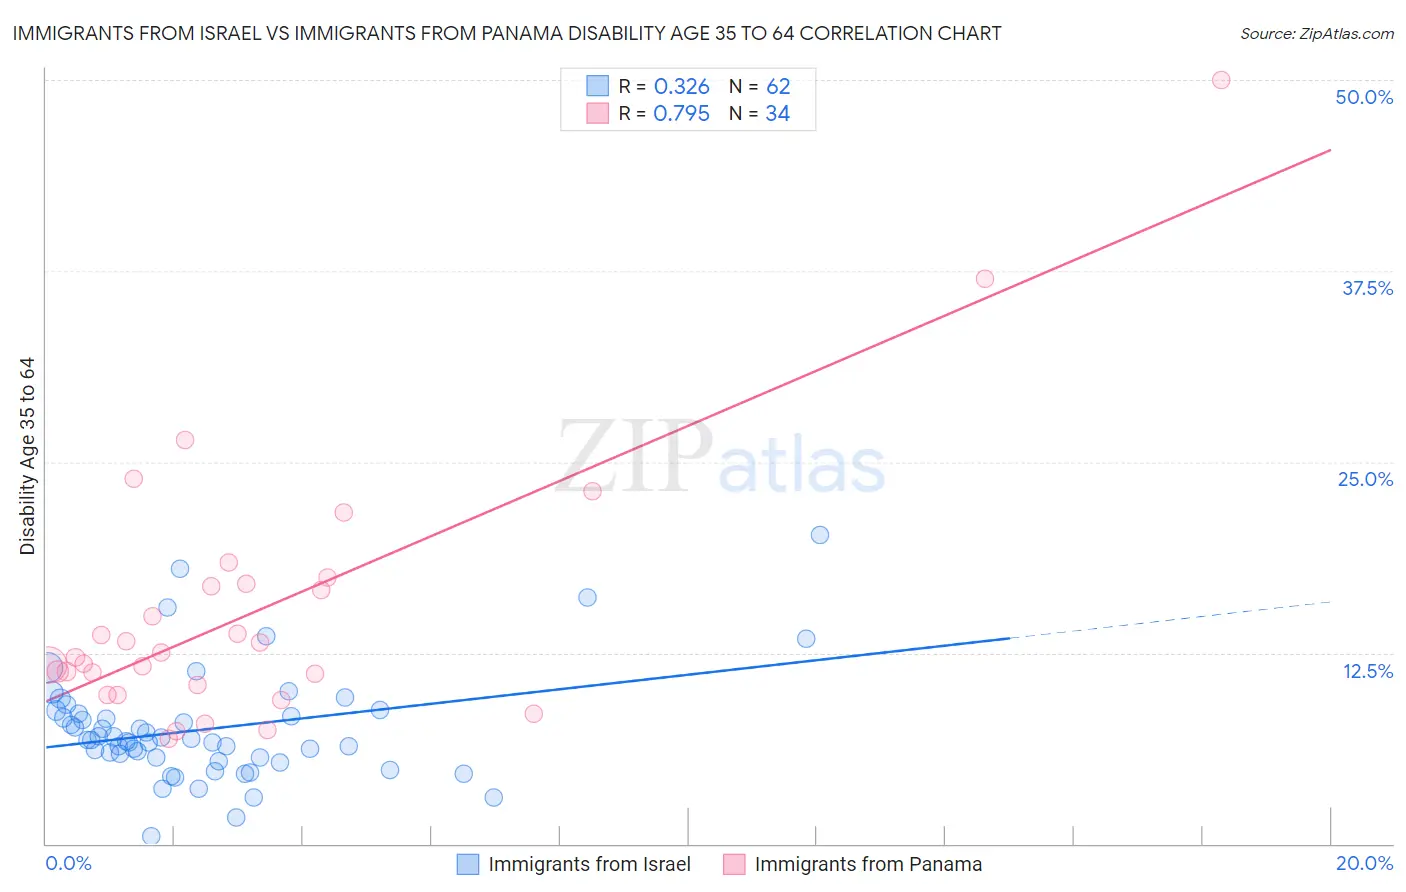
Immigrants from Israel vs Immigrants from Panama Disability Age 35 to 64 Correlation Chart

The statistical analysis conducted on geographies consisting of 209,961,386 people shows a mild positive correlation between the proportion of Immigrants from Israel and percentage of population with a disability between the ages 34 and 64 in the United States with a correlation coefficient (R) of 0.326 and weighted average of 8.6%. Similarly, the statistical analysis conducted on geographies consisting of 221,148,326 people shows a strong positive correlation between the proportion of Immigrants from Panama and percentage of population with a disability between the ages 34 and 64 in the United States with a correlation coefficient (R) of 0.795 and weighted average of 11.6%, a difference of 34.5%.
Immigrants from Israel vs Immigrants from Panama Disability Age 35 to 64

Disability Age 35 to 64 Correlation Summary

MeasurementImmigrants from IsraelImmigrants from Panama
Minimum0.52%6.9%
Maximum20.2%50.0%
Range19.7%43.1%
Mean7.5%15.3%
Median6.8%12.4%
Interquartile 25% (IQ1)5.6%10.4%
Interquartile 75% (IQ3)8.5%17.0%
Interquartile Range (IQR)2.9%6.6%
Standard Deviation (Sample)3.6%8.8%
Standard Deviation (Population)3.6%8.7%

Similar Demographics by Disability Age 35 to 64

Demographics Similar to Immigrants from Israel by Disability Age 35 to 64

In terms of disability age 35 to 64, the demographic groups most similar to Immigrants from Israel are Thai (8.6%, a difference of 0.42%), Iranian (8.7%, a difference of 0.58%), Immigrants from China (8.7%, a difference of 1.0%), Immigrants from Bolivia (8.7%, a difference of 1.3%), and Immigrants from Iran (8.5%, a difference of 1.4%).
DemographicsRating | RankDisability Age 35 to 64
Immigrants | Taiwan
100.0
/100
|
#1
Exceptional
7.8%
Filipinos
100.0
/100
|
#2
Exceptional
8.0%
Immigrants | Hong Kong
100.0
/100
|
#3
Exceptional
8.2%
Immigrants | India
100.0
/100
|
#4
Exceptional
8.3%
Immigrants | Iran
100.0
/100
|
#5
Exceptional
8.5%
Thais
100.0
/100
|
#6
Exceptional
8.6%
Immigrants | Israel
100.0
/100
|
#7
Exceptional
8.6%
Iranians
100.0
/100
|
#8
Exceptional
8.7%
Immigrants | China
100.0
/100
|
#9
Exceptional
8.7%
Immigrants | Bolivia
100.0
/100
|
#10
Exceptional
8.7%
Immigrants | Eastern Asia
100.0
/100
|
#11
Exceptional
8.8%
Indians (Asian)
100.0
/100
|
#12
Exceptional
8.9%
Immigrants | South Central Asia
100.0
/100
|
#13
Exceptional
8.9%
Immigrants | Singapore
100.0
/100
|
#14
Exceptional
8.9%
Bolivians
100.0
/100
|
#15
Exceptional
8.9%

Demographics Similar to Immigrants from Panama by Disability Age 35 to 64

In terms of disability age 35 to 64, the demographic groups most similar to Immigrants from Panama are Immigrants from Iraq (11.6%, a difference of 0.080%), Basque (11.6%, a difference of 0.11%), Swiss (11.6%, a difference of 0.21%), Immigrants from Kenya (11.6%, a difference of 0.34%), and Immigrants from Guatemala (11.6%, a difference of 0.36%).
DemographicsRating | RankDisability Age 35 to 64
Swedes
31.3
/100
|
#191
Fair
11.4%
Norwegians
29.7
/100
|
#192
Fair
11.5%
Immigrants | Africa
29.0
/100
|
#193
Fair
11.5%
Immigrants | Latin America
27.5
/100
|
#194
Fair
11.5%
Carpatho Rusyns
25.3
/100
|
#195
Fair
11.5%
Iraqis
24.2
/100
|
#196
Fair
11.5%
Immigrants | Iraq
21.0
/100
|
#197
Fair
11.6%
Immigrants | Panama
20.4
/100
|
#198
Fair
11.6%
Basques
19.5
/100
|
#199
Poor
11.6%
Swiss
18.7
/100
|
#200
Poor
11.6%
Immigrants | Kenya
17.7
/100
|
#201
Poor
11.6%
Immigrants | Guatemala
17.5
/100
|
#202
Poor
11.6%
British
17.0
/100
|
#203
Poor
11.6%
Nigerians
16.3
/100
|
#204
Poor
11.6%
Slavs
15.5
/100
|
#205
Poor
11.7%