Immigrants from India vs Immigrants from Morocco Ambulatory Disability

COMPARE

Immigrants from India
Race
Ancestry
AfghanAfricanAlaska NativeAlaskan AthabascanAlbanianAleutAlsatianAmericanApacheArabArapahoArgentineanArmenianAssyrian/Chaldean/SyriacAustralianAustrianBahamianBangladeshiBarbadianBasqueBelgianBelizeanBermudanBhutaneseBlackfeetBolivianBrazilianBritishBritish West IndianBulgarianBurmeseCajunCambodianCanadianCape VerdeanCarpatho RusynCelticCentral AmericanCentral American IndianCherokeeCheyenneChickasawChileanChineseChippewaChoctawColombianColvilleComancheCosta RicanCreeCreekCroatianCrowCubanCypriotCzechCzechoslovakianDanishDelawareDominicanDutchDutch West IndianEastern EuropeanEcuadorianEgyptianEnglishEstonianEthiopianEuropeanFijianFilipinoFinnishFrenchFrench American IndianFrench CanadianGermanGerman RussianGhanaianGreekGuamanian/ChamorroGuatemalanGuyaneseHaitianHmongHonduranHopiHoumaHungarianIcelanderIndian (Asian)IndonesianInupiatIranianIraqiIrishIroquoisIsraeliItalianJamaicanJapaneseJordanianKenyanKiowaKoreanLaotianLatvianLebaneseLiberianLithuanianLumbeeLuxembourgerMacedonianMalaysianMalteseMarshalleseMenomineeMexicanMexican American IndianMongolianMoroccanNative HawaiianNavajoNepaleseNew ZealanderNicaraguanNigerianNorthern EuropeanNorwegianOkinawanOsageOttawaPaiutePakistaniPalestinianPanamanianParaguayanPennsylvania GermanPeruvianPimaPolishPortuguesePotawatomiPuebloPuerto RicanPuget Sound SalishRomanianRussianSalvadoranSamoanScandinavianScotch-IrishScottishSeminoleSenegaleseSerbianShoshoneSierra LeoneanSiouxSlavicSlovakSloveneSomaliSouth AfricanSouth AmericanSouth American IndianSoviet UnionSpaniardSpanishSpanish AmericanSpanish American IndianSri LankanSubsaharan AfricanSudaneseSwedishSwissSyrianTaiwaneseThaiTlingit-HaidaTohono O'OdhamTonganTrinidadian and TobagonianTsimshianTurkishU.S. Virgin IslanderUgandanUkrainianUruguayanUteVenezuelanVietnameseWelshWest IndianYakamaYaquiYugoslavianYumanYup'ikZimbabwean
Immigration
NonimmigrantsImmigrantsAfghanistanAfricaAlbaniaArgentinaArmeniaAsiaAustraliaAustriaBahamasBangladeshBarbadosBelarusBelgiumBelizeBoliviaBosnia and HerzegovinaBrazilBulgariaBurma/MyanmarCabo VerdeCambodiaCameroonCanadaCaribbeanCentral AmericaChileChinaColombiaCongoCosta RicaCroatiaCubaCzechoslovakiaDenmarkDominicaDominican RepublicEastern AfricaEastern AsiaEastern EuropeEcuadorEgyptEl SalvadorEnglandEritreaEthiopiaEuropeFijiFranceGermanyGhanaGreeceGrenadaGuatemalaGuyanaHaitiHondurasHong KongHungaryIndiaIndonesiaIranIraqIrelandIsraelItalyJamaicaJapanJordanKazakhstanKenyaKoreaKuwaitLaosLatin AmericaLatviaLebanonLiberiaLithuaniaMalaysiaMexicoMicronesiaMiddle AfricaMoldovaNepalNetherlandsNicaraguaNigeriaNorth AmericaNorth MacedoniaNorthern AfricaNorthern EuropeNorwayOceaniaPakistanPanamaPeruPhilippinesPolandPortugalRomaniaRussiaSaudi ArabiaScotlandSenegalSerbiaSierra LeoneSingaporeSomaliaSouth AfricaSouth AmericaSouth Central AsiaSouth Eastern AsiaSouthern EuropeSpainSri LankaSt. Vincent and the GrenadinesSudanSwedenSwitzerlandSyriaTaiwanThailandTrinidad and TobagoTurkeyUgandaUkraineUruguayUzbekistanVenezuelaVietnamWest IndiesWestern AfricaWestern AsiaWestern EuropeYemenZaireZimbabweAzores
Immigrants from Morocco
Race
Ancestry
AfghanAfricanAlaska NativeAlaskan AthabascanAlbanianAleutAlsatianAmericanApacheArabArapahoArgentineanArmenianAssyrian/Chaldean/SyriacAustralianAustrianBahamianBangladeshiBarbadianBasqueBelgianBelizeanBermudanBhutaneseBlackfeetBolivianBrazilianBritishBritish West IndianBulgarianBurmeseCajunCambodianCanadianCape VerdeanCarpatho RusynCelticCentral AmericanCentral American IndianCherokeeCheyenneChickasawChileanChineseChippewaChoctawColombianColvilleComancheCosta RicanCreeCreekCroatianCrowCubanCypriotCzechCzechoslovakianDanishDelawareDominicanDutchDutch West IndianEastern EuropeanEcuadorianEgyptianEnglishEstonianEthiopianEuropeanFijianFilipinoFinnishFrenchFrench American IndianFrench CanadianGermanGerman RussianGhanaianGreekGuamanian/ChamorroGuatemalanGuyaneseHaitianHmongHonduranHopiHoumaHungarianIcelanderIndian (Asian)IndonesianInupiatIranianIraqiIrishIroquoisIsraeliItalianJamaicanJapaneseJordanianKenyanKiowaKoreanLaotianLatvianLebaneseLiberianLithuanianLumbeeLuxembourgerMacedonianMalaysianMalteseMarshalleseMenomineeMexicanMexican American IndianMongolianMoroccanNative HawaiianNavajoNepaleseNew ZealanderNicaraguanNigerianNorthern EuropeanNorwegianOkinawanOsageOttawaPaiutePakistaniPalestinianPanamanianParaguayanPennsylvania GermanPeruvianPimaPolishPortuguesePotawatomiPuebloPuerto RicanPuget Sound SalishRomanianRussianSalvadoranSamoanScandinavianScotch-IrishScottishSeminoleSenegaleseSerbianShoshoneSierra LeoneanSiouxSlavicSlovakSloveneSomaliSouth AfricanSouth AmericanSouth American IndianSoviet UnionSpaniardSpanishSpanish AmericanSpanish American IndianSri LankanSubsaharan AfricanSudaneseSwedishSwissSyrianTaiwaneseThaiTlingit-HaidaTohono O'OdhamTonganTrinidadian and TobagonianTsimshianTurkishU.S. Virgin IslanderUgandanUkrainianUruguayanUteVenezuelanVietnameseWelshWest IndianYakamaYaquiYugoslavianYumanYup'ikZimbabwean
Immigration
NonimmigrantsImmigrantsAfghanistanAfricaAlbaniaArgentinaArmeniaAsiaAustraliaAustriaBahamasBangladeshBarbadosBelarusBelgiumBelizeBoliviaBosnia and HerzegovinaBrazilBulgariaBurma/MyanmarCabo VerdeCambodiaCameroonCanadaCaribbeanCentral AmericaChileChinaColombiaCongoCosta RicaCroatiaCubaCzechoslovakiaDenmarkDominicaDominican RepublicEastern AfricaEastern AsiaEastern EuropeEcuadorEgyptEl SalvadorEnglandEritreaEthiopiaEuropeFijiFranceGermanyGhanaGreeceGrenadaGuatemalaGuyanaHaitiHondurasHong KongHungaryIndonesiaIranIraqIrelandIsraelItalyJamaicaJapanJordanKazakhstanKenyaKoreaKuwaitLaosLatin AmericaLatviaLebanonLiberiaLithuaniaMalaysiaMexicoMicronesiaMiddle AfricaMoldovaMoroccoNepalNetherlandsNicaraguaNigeriaNorth AmericaNorth MacedoniaNorthern AfricaNorthern EuropeNorwayOceaniaPakistanPanamaPeruPhilippinesPolandPortugalRomaniaRussiaSaudi ArabiaScotlandSenegalSerbiaSierra LeoneSingaporeSomaliaSouth AfricaSouth AmericaSouth Central AsiaSouth Eastern AsiaSouthern EuropeSpainSri LankaSt. Vincent and the GrenadinesSudanSwedenSwitzerlandSyriaTaiwanThailandTrinidad and TobagoTurkeyUgandaUkraineUruguayUzbekistanVenezuelaVietnamWest IndiesWestern AfricaWestern AsiaWestern EuropeYemenZaireZimbabweAzores
Ambulatory Disability
Income
Poverty
Unemployment
Labor Participation
Family Structure
Vehicle Availability
Education Level
Disability

Ambulatory Disability Comparison

Immigrants from India

Immigrants from Morocco

Exceptional
Exceptional
4.8%
AMBULATORY DISABILITY
100.0/ 100
METRIC RATING
1st/ 347
METRIC RANK
5.8%
AMBULATORY DISABILITY
97.3/ 100
METRIC RATING
106th/ 347
METRIC RANK

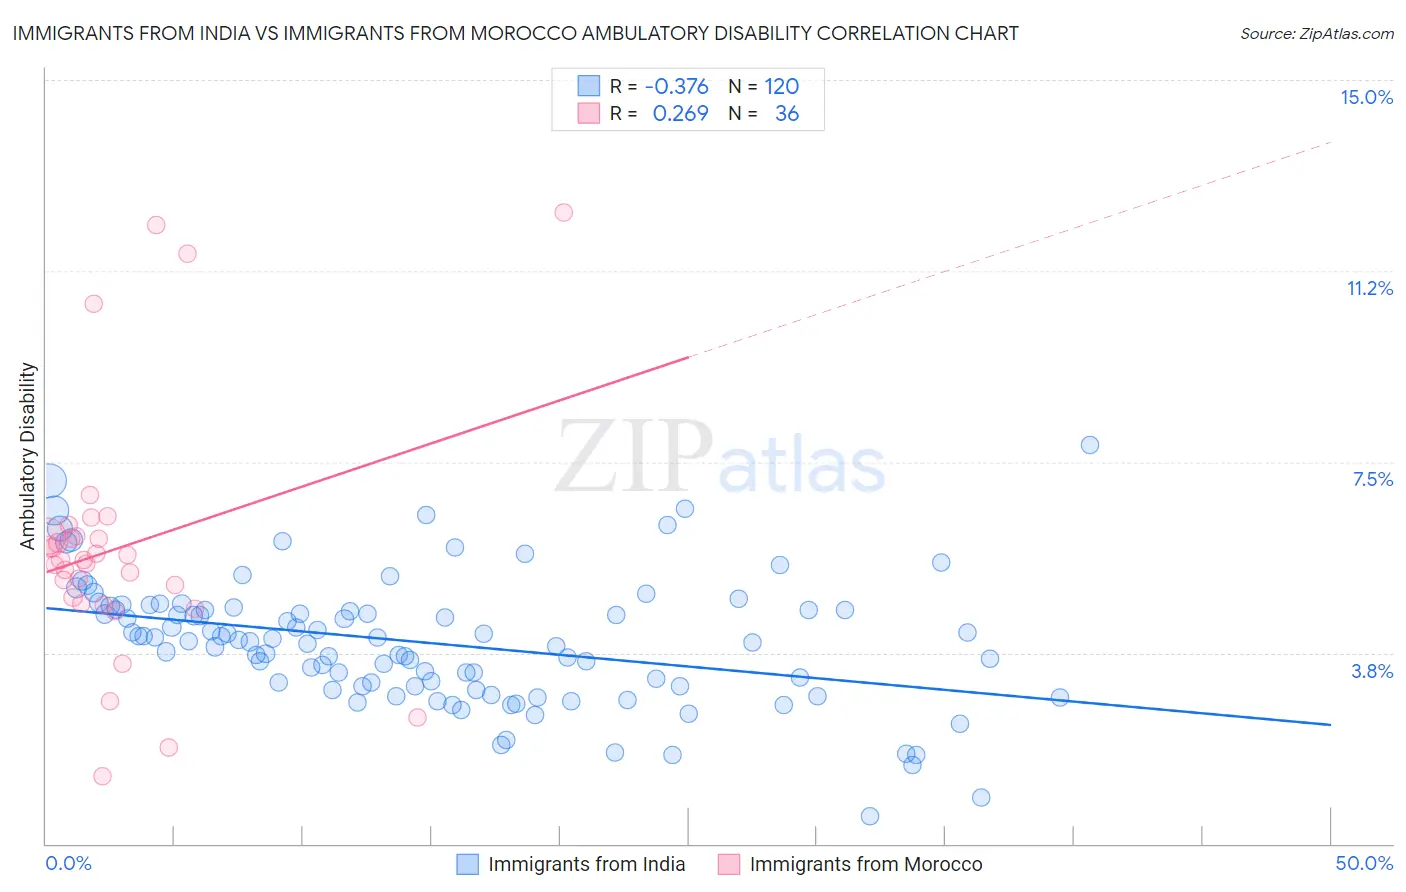
Immigrants from India vs Immigrants from Morocco Ambulatory Disability Correlation Chart

The statistical analysis conducted on geographies consisting of 433,949,483 people shows a mild negative correlation between the proportion of Immigrants from India and percentage of population with ambulatory disability in the United States with a correlation coefficient (R) of -0.376 and weighted average of 4.8%. Similarly, the statistical analysis conducted on geographies consisting of 178,910,370 people shows a weak positive correlation between the proportion of Immigrants from Morocco and percentage of population with ambulatory disability in the United States with a correlation coefficient (R) of 0.269 and weighted average of 5.8%, a difference of 22.2%.
Immigrants from India vs Immigrants from Morocco Ambulatory Disability

Ambulatory Disability Correlation Summary

MeasurementImmigrants from IndiaImmigrants from Morocco
Minimum0.54%1.3%
Maximum7.8%12.4%
Range7.3%11.1%
Mean4.0%5.8%
Median4.0%5.6%
Interquartile 25% (IQ1)3.1%4.8%
Interquartile 75% (IQ3)4.6%6.0%
Interquartile Range (IQR)1.5%1.3%
Standard Deviation (Sample)1.3%2.5%
Standard Deviation (Population)1.2%2.4%

Similar Demographics by Ambulatory Disability

Demographics Similar to Immigrants from India by Ambulatory Disability

In terms of ambulatory disability, the demographic groups most similar to Immigrants from India are Filipino (4.9%, a difference of 2.0%), Thai (4.9%, a difference of 3.2%), Immigrants from Taiwan (4.9%, a difference of 3.5%), Immigrants from Singapore (5.0%, a difference of 4.9%), and Immigrants from Bolivia (5.0%, a difference of 5.7%).
DemographicsRating | RankAmbulatory Disability
Immigrants | India
100.0
/100
|
#1
Exceptional
4.8%
Filipinos
100.0
/100
|
#2
Exceptional
4.9%
Thais
100.0
/100
|
#3
Exceptional
4.9%
Immigrants | Taiwan
100.0
/100
|
#4
Exceptional
4.9%
Immigrants | Singapore
100.0
/100
|
#5
Exceptional
5.0%
Immigrants | Bolivia
100.0
/100
|
#6
Exceptional
5.0%
Bolivians
100.0
/100
|
#7
Exceptional
5.1%
Immigrants | South Central Asia
100.0
/100
|
#8
Exceptional
5.1%
Iranians
100.0
/100
|
#9
Exceptional
5.1%
Yup'ik
100.0
/100
|
#10
Exceptional
5.2%
Immigrants | Korea
100.0
/100
|
#11
Exceptional
5.2%
Okinawans
100.0
/100
|
#12
Exceptional
5.3%
Burmese
100.0
/100
|
#13
Exceptional
5.3%
Immigrants | Eastern Asia
100.0
/100
|
#14
Exceptional
5.3%
Immigrants | China
100.0
/100
|
#15
Exceptional
5.3%

Demographics Similar to Immigrants from Morocco by Ambulatory Disability

In terms of ambulatory disability, the demographic groups most similar to Immigrants from Morocco are Uruguayan (5.8%, a difference of 0.050%), Immigrants from Czechoslovakia (5.8%, a difference of 0.070%), Colombian (5.8%, a difference of 0.070%), Immigrants from Netherlands (5.8%, a difference of 0.080%), and New Zealander (5.8%, a difference of 0.18%).
DemographicsRating | RankAmbulatory Disability
Immigrants | Northern Europe
98.2
/100
|
#99
Exceptional
5.8%
Immigrants | Serbia
97.9
/100
|
#100
Exceptional
5.8%
Immigrants | South America
97.9
/100
|
#101
Exceptional
5.8%
Immigrants | Kenya
97.8
/100
|
#102
Exceptional
5.8%
Immigrants | Romania
97.7
/100
|
#103
Exceptional
5.8%
New Zealanders
97.6
/100
|
#104
Exceptional
5.8%
Immigrants | Czechoslovakia
97.4
/100
|
#105
Exceptional
5.8%
Immigrants | Morocco
97.3
/100
|
#106
Exceptional
5.8%
Uruguayans
97.2
/100
|
#107
Exceptional
5.8%
Colombians
97.2
/100
|
#108
Exceptional
5.8%
Immigrants | Netherlands
97.1
/100
|
#109
Exceptional
5.8%
Immigrants | Colombia
96.7
/100
|
#110
Exceptional
5.8%
Danes
96.6
/100
|
#111
Exceptional
5.8%
South Africans
96.3
/100
|
#112
Exceptional
5.9%
Immigrants | Uruguay
95.6
/100
|
#113
Exceptional
5.9%