Immigrants from India vs Eastern European Ambulatory Disability

COMPARE

Immigrants from India
Race
Ancestry
AfghanAfricanAlaska NativeAlaskan AthabascanAlbanianAleutAlsatianAmericanApacheArabArapahoArgentineanArmenianAssyrian/Chaldean/SyriacAustralianAustrianBahamianBangladeshiBarbadianBasqueBelgianBelizeanBermudanBhutaneseBlackfeetBolivianBrazilianBritishBritish West IndianBulgarianBurmeseCajunCambodianCanadianCape VerdeanCarpatho RusynCelticCentral AmericanCentral American IndianCherokeeCheyenneChickasawChileanChineseChippewaChoctawColombianColvilleComancheCosta RicanCreeCreekCroatianCrowCubanCypriotCzechCzechoslovakianDanishDelawareDominicanDutchDutch West IndianEcuadorianEgyptianEnglishEstonianEthiopianEuropeanFijianFilipinoFinnishFrenchFrench American IndianFrench CanadianGermanGerman RussianGhanaianGreekGuamanian/ChamorroGuatemalanGuyaneseHaitianHmongHonduranHopiHoumaHungarianIcelanderIndian (Asian)IndonesianInupiatIranianIraqiIrishIroquoisIsraeliItalianJamaicanJapaneseJordanianKenyanKiowaKoreanLaotianLatvianLebaneseLiberianLithuanianLumbeeLuxembourgerMacedonianMalaysianMalteseMarshalleseMenomineeMexicanMexican American IndianMongolianMoroccanNative HawaiianNavajoNepaleseNew ZealanderNicaraguanNigerianNorthern EuropeanNorwegianOkinawanOsageOttawaPaiutePakistaniPalestinianPanamanianParaguayanPennsylvania GermanPeruvianPimaPolishPortuguesePotawatomiPuebloPuerto RicanPuget Sound SalishRomanianRussianSalvadoranSamoanScandinavianScotch-IrishScottishSeminoleSenegaleseSerbianShoshoneSierra LeoneanSiouxSlavicSlovakSloveneSomaliSouth AfricanSouth AmericanSouth American IndianSoviet UnionSpaniardSpanishSpanish AmericanSpanish American IndianSri LankanSubsaharan AfricanSudaneseSwedishSwissSyrianTaiwaneseThaiTlingit-HaidaTohono O'OdhamTonganTrinidadian and TobagonianTsimshianTurkishU.S. Virgin IslanderUgandanUkrainianUruguayanUteVenezuelanVietnameseWelshWest IndianYakamaYaquiYugoslavianYumanYup'ikZimbabwean
Immigration
NonimmigrantsImmigrantsAfghanistanAfricaAlbaniaArgentinaArmeniaAsiaAustraliaAustriaBahamasBangladeshBarbadosBelarusBelgiumBelizeBoliviaBosnia and HerzegovinaBrazilBulgariaBurma/MyanmarCabo VerdeCambodiaCameroonCanadaCaribbeanCentral AmericaChileChinaColombiaCongoCosta RicaCroatiaCubaCzechoslovakiaDenmarkDominicaDominican RepublicEastern AfricaEastern AsiaEastern EuropeEcuadorEgyptEl SalvadorEnglandEritreaEthiopiaEuropeFijiFranceGermanyGhanaGreeceGrenadaGuatemalaGuyanaHaitiHondurasHong KongHungaryIndiaIndonesiaIranIraqIrelandIsraelItalyJamaicaJapanJordanKazakhstanKenyaKoreaKuwaitLaosLatin AmericaLatviaLebanonLiberiaLithuaniaMalaysiaMexicoMicronesiaMiddle AfricaMoldovaMoroccoNepalNetherlandsNicaraguaNigeriaNorth AmericaNorth MacedoniaNorthern AfricaNorthern EuropeNorwayOceaniaPakistanPanamaPeruPhilippinesPolandPortugalRomaniaRussiaSaudi ArabiaScotlandSenegalSerbiaSierra LeoneSingaporeSomaliaSouth AfricaSouth AmericaSouth Central AsiaSouth Eastern AsiaSouthern EuropeSpainSri LankaSt. Vincent and the GrenadinesSudanSwedenSwitzerlandSyriaTaiwanThailandTrinidad and TobagoTurkeyUgandaUkraineUruguayUzbekistanVenezuelaVietnamWest IndiesWestern AfricaWestern AsiaWestern EuropeYemenZaireZimbabweAzores
Eastern European
Race
Ancestry
AfghanAfricanAlaska NativeAlaskan AthabascanAlbanianAleutAlsatianAmericanApacheArabArapahoArgentineanArmenianAssyrian/Chaldean/SyriacAustralianAustrianBahamianBangladeshiBarbadianBasqueBelgianBelizeanBermudanBhutaneseBlackfeetBolivianBrazilianBritishBritish West IndianBulgarianBurmeseCajunCambodianCanadianCape VerdeanCarpatho RusynCelticCentral AmericanCentral American IndianCherokeeCheyenneChickasawChileanChineseChippewaChoctawColombianColvilleComancheCosta RicanCreeCreekCroatianCrowCubanCypriotCzechCzechoslovakianDanishDelawareDominicanDutchDutch West IndianEastern EuropeanEcuadorianEgyptianEnglishEstonianEthiopianEuropeanFijianFilipinoFinnishFrenchFrench American IndianFrench CanadianGermanGerman RussianGhanaianGreekGuamanian/ChamorroGuatemalanGuyaneseHaitianHmongHonduranHopiHoumaHungarianIcelanderIndian (Asian)IndonesianInupiatIranianIraqiIrishIroquoisIsraeliItalianJamaicanJapaneseJordanianKenyanKiowaKoreanLaotianLatvianLebaneseLiberianLithuanianLumbeeLuxembourgerMacedonianMalaysianMalteseMarshalleseMenomineeMexicanMexican American IndianMongolianMoroccanNative HawaiianNavajoNepaleseNew ZealanderNicaraguanNigerianNorthern EuropeanNorwegianOkinawanOsageOttawaPaiutePakistaniPalestinianPanamanianParaguayanPennsylvania GermanPeruvianPimaPolishPortuguesePotawatomiPuebloPuerto RicanPuget Sound SalishRomanianRussianSalvadoranSamoanScandinavianScotch-IrishScottishSeminoleSenegaleseSerbianShoshoneSierra LeoneanSiouxSlavicSlovakSloveneSomaliSouth AfricanSouth AmericanSouth American IndianSoviet UnionSpaniardSpanishSpanish AmericanSpanish American IndianSri LankanSubsaharan AfricanSudaneseSwedishSwissSyrianTaiwaneseThaiTlingit-HaidaTohono O'OdhamTonganTrinidadian and TobagonianTsimshianTurkishU.S. Virgin IslanderUgandanUkrainianUruguayanUteVenezuelanVietnameseWelshWest IndianYakamaYaquiYugoslavianYumanYup'ikZimbabwean
Immigration
NonimmigrantsImmigrantsAfghanistanAfricaAlbaniaArgentinaArmeniaAsiaAustraliaAustriaBahamasBangladeshBarbadosBelarusBelgiumBelizeBoliviaBosnia and HerzegovinaBrazilBulgariaBurma/MyanmarCabo VerdeCambodiaCameroonCanadaCaribbeanCentral AmericaChileChinaColombiaCongoCosta RicaCroatiaCubaCzechoslovakiaDenmarkDominicaDominican RepublicEastern AfricaEastern AsiaEastern EuropeEcuadorEgyptEl SalvadorEnglandEritreaEthiopiaEuropeFijiFranceGermanyGhanaGreeceGrenadaGuatemalaGuyanaHaitiHondurasHong KongHungaryIndonesiaIranIraqIrelandIsraelItalyJamaicaJapanJordanKazakhstanKenyaKoreaKuwaitLaosLatin AmericaLatviaLebanonLiberiaLithuaniaMalaysiaMexicoMicronesiaMiddle AfricaMoldovaMoroccoNepalNetherlandsNicaraguaNigeriaNorth AmericaNorth MacedoniaNorthern AfricaNorthern EuropeNorwayOceaniaPakistanPanamaPeruPhilippinesPolandPortugalRomaniaRussiaSaudi ArabiaScotlandSenegalSerbiaSierra LeoneSingaporeSomaliaSouth AfricaSouth AmericaSouth Central AsiaSouth Eastern AsiaSouthern EuropeSpainSri LankaSt. Vincent and the GrenadinesSudanSwedenSwitzerlandSyriaTaiwanThailandTrinidad and TobagoTurkeyUgandaUkraineUruguayUzbekistanVenezuelaVietnamWest IndiesWestern AfricaWestern AsiaWestern EuropeYemenZaireZimbabweAzores
Ambulatory Disability
Income
Poverty
Unemployment
Labor Participation
Family Structure
Vehicle Availability
Education Level
Disability

Ambulatory Disability Comparison

Immigrants from India

Eastern Europeans

Exceptional
Exceptional
4.8%
AMBULATORY DISABILITY
100.0/ 100
METRIC RATING
1st/ 347
METRIC RANK
5.7%
AMBULATORY DISABILITY
99.2/ 100
METRIC RATING
83rd/ 347
METRIC RANK

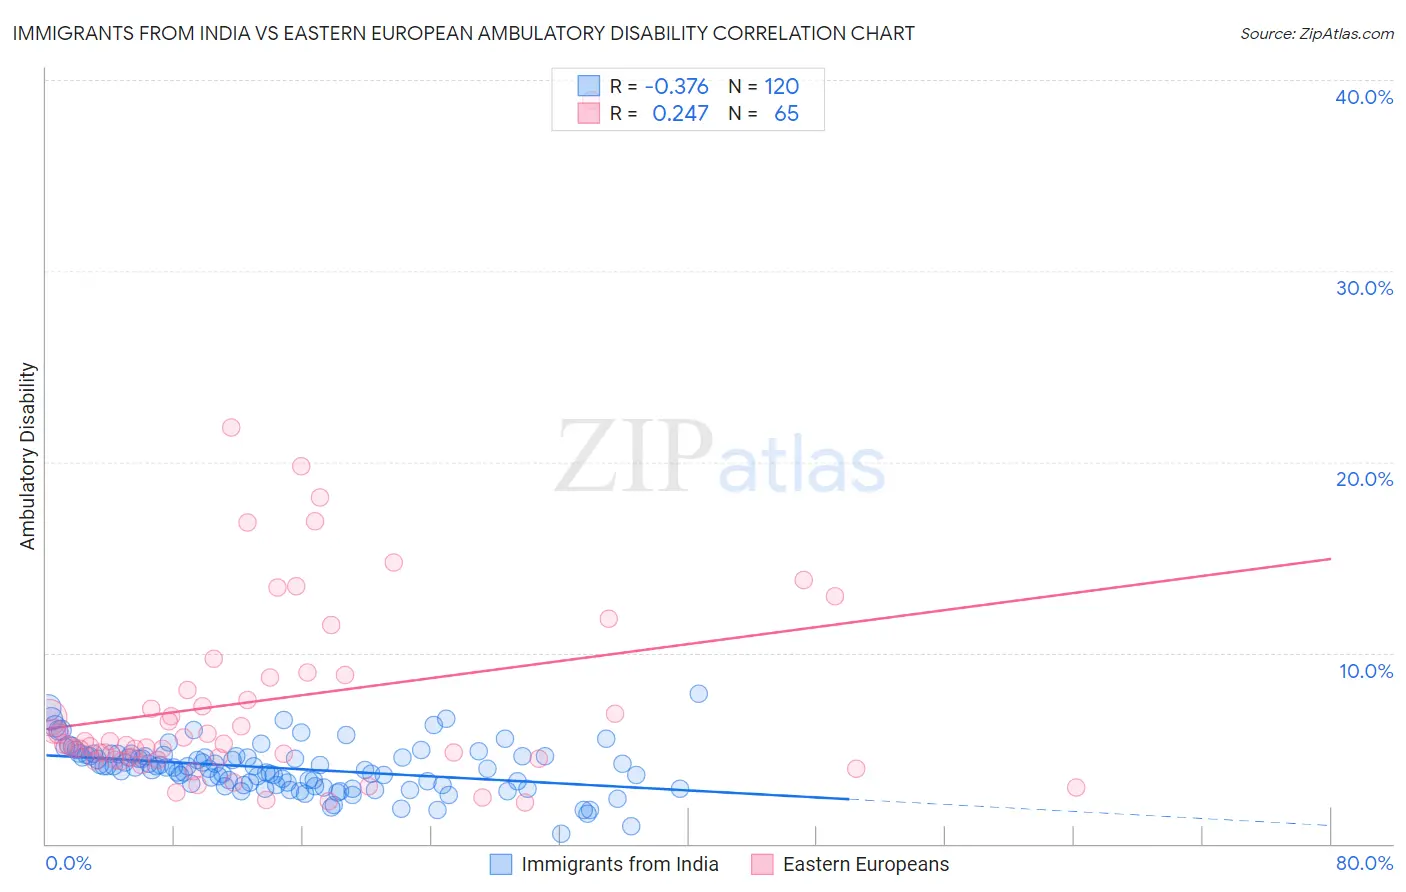
Immigrants from India vs Eastern European Ambulatory Disability Correlation Chart

The statistical analysis conducted on geographies consisting of 433,949,483 people shows a mild negative correlation between the proportion of Immigrants from India and percentage of population with ambulatory disability in the United States with a correlation coefficient (R) of -0.376 and weighted average of 4.8%. Similarly, the statistical analysis conducted on geographies consisting of 461,048,230 people shows a weak positive correlation between the proportion of Eastern Europeans and percentage of population with ambulatory disability in the United States with a correlation coefficient (R) of 0.247 and weighted average of 5.7%, a difference of 20.2%.
Immigrants from India vs Eastern European Ambulatory Disability

Ambulatory Disability Correlation Summary

MeasurementImmigrants from IndiaEastern European
Minimum0.54%2.2%
Maximum7.8%39.0%
Range7.3%36.8%
Mean4.0%7.6%
Median4.0%5.3%
Interquartile 25% (IQ1)3.1%4.4%
Interquartile 75% (IQ3)4.6%8.8%
Interquartile Range (IQR)1.5%4.4%
Standard Deviation (Sample)1.3%6.0%
Standard Deviation (Population)1.2%5.9%

Similar Demographics by Ambulatory Disability

Demographics Similar to Immigrants from India by Ambulatory Disability

In terms of ambulatory disability, the demographic groups most similar to Immigrants from India are Filipino (4.9%, a difference of 2.0%), Thai (4.9%, a difference of 3.2%), Immigrants from Taiwan (4.9%, a difference of 3.5%), Immigrants from Singapore (5.0%, a difference of 4.9%), and Immigrants from Bolivia (5.0%, a difference of 5.7%).
DemographicsRating | RankAmbulatory Disability
Immigrants | India
100.0
/100
|
#1
Exceptional
4.8%
Filipinos
100.0
/100
|
#2
Exceptional
4.9%
Thais
100.0
/100
|
#3
Exceptional
4.9%
Immigrants | Taiwan
100.0
/100
|
#4
Exceptional
4.9%
Immigrants | Singapore
100.0
/100
|
#5
Exceptional
5.0%
Immigrants | Bolivia
100.0
/100
|
#6
Exceptional
5.0%
Bolivians
100.0
/100
|
#7
Exceptional
5.1%
Immigrants | South Central Asia
100.0
/100
|
#8
Exceptional
5.1%
Iranians
100.0
/100
|
#9
Exceptional
5.1%
Yup'ik
100.0
/100
|
#10
Exceptional
5.2%
Immigrants | Korea
100.0
/100
|
#11
Exceptional
5.2%
Okinawans
100.0
/100
|
#12
Exceptional
5.3%
Burmese
100.0
/100
|
#13
Exceptional
5.3%
Immigrants | Eastern Asia
100.0
/100
|
#14
Exceptional
5.3%
Immigrants | China
100.0
/100
|
#15
Exceptional
5.3%

Demographics Similar to Eastern Europeans by Ambulatory Disability

In terms of ambulatory disability, the demographic groups most similar to Eastern Europeans are Ugandan (5.7%, a difference of 0.0%), Immigrants from Jordan (5.7%, a difference of 0.020%), Palestinian (5.7%, a difference of 0.020%), Immigrants from Ireland (5.7%, a difference of 0.030%), and Chilean (5.7%, a difference of 0.16%).
DemographicsRating | RankAmbulatory Disability
Sudanese
99.3
/100
|
#76
Exceptional
5.7%
Immigrants | Vietnam
99.3
/100
|
#77
Exceptional
5.7%
Somalis
99.2
/100
|
#78
Exceptional
5.7%
Chileans
99.2
/100
|
#79
Exceptional
5.7%
Immigrants | Ireland
99.2
/100
|
#80
Exceptional
5.7%
Immigrants | Jordan
99.2
/100
|
#81
Exceptional
5.7%
Palestinians
99.2
/100
|
#82
Exceptional
5.7%
Eastern Europeans
99.2
/100
|
#83
Exceptional
5.7%
Ugandans
99.2
/100
|
#84
Exceptional
5.7%
South Americans
99.0
/100
|
#85
Exceptional
5.7%
Latvians
99.0
/100
|
#86
Exceptional
5.7%
Immigrants | Chile
98.9
/100
|
#87
Exceptional
5.8%
Soviet Union
98.9
/100
|
#88
Exceptional
5.8%
Bhutanese
98.8
/100
|
#89
Exceptional
5.8%
Australians
98.8
/100
|
#90
Exceptional
5.8%