Immigrants from Costa Rica vs Cuban Male Disability
COMPARE
Immigrants from Costa Rica
Cuban
Male Disability
Male Disability Comparison
Immigrants from Costa Rica
Cubans
11.0%
MALE DISABILITY
82.8/ 100
METRIC RATING
136th/ 347
METRIC RANK
11.0%
MALE DISABILITY
74.9/ 100
METRIC RATING
151st/ 347
METRIC RANK
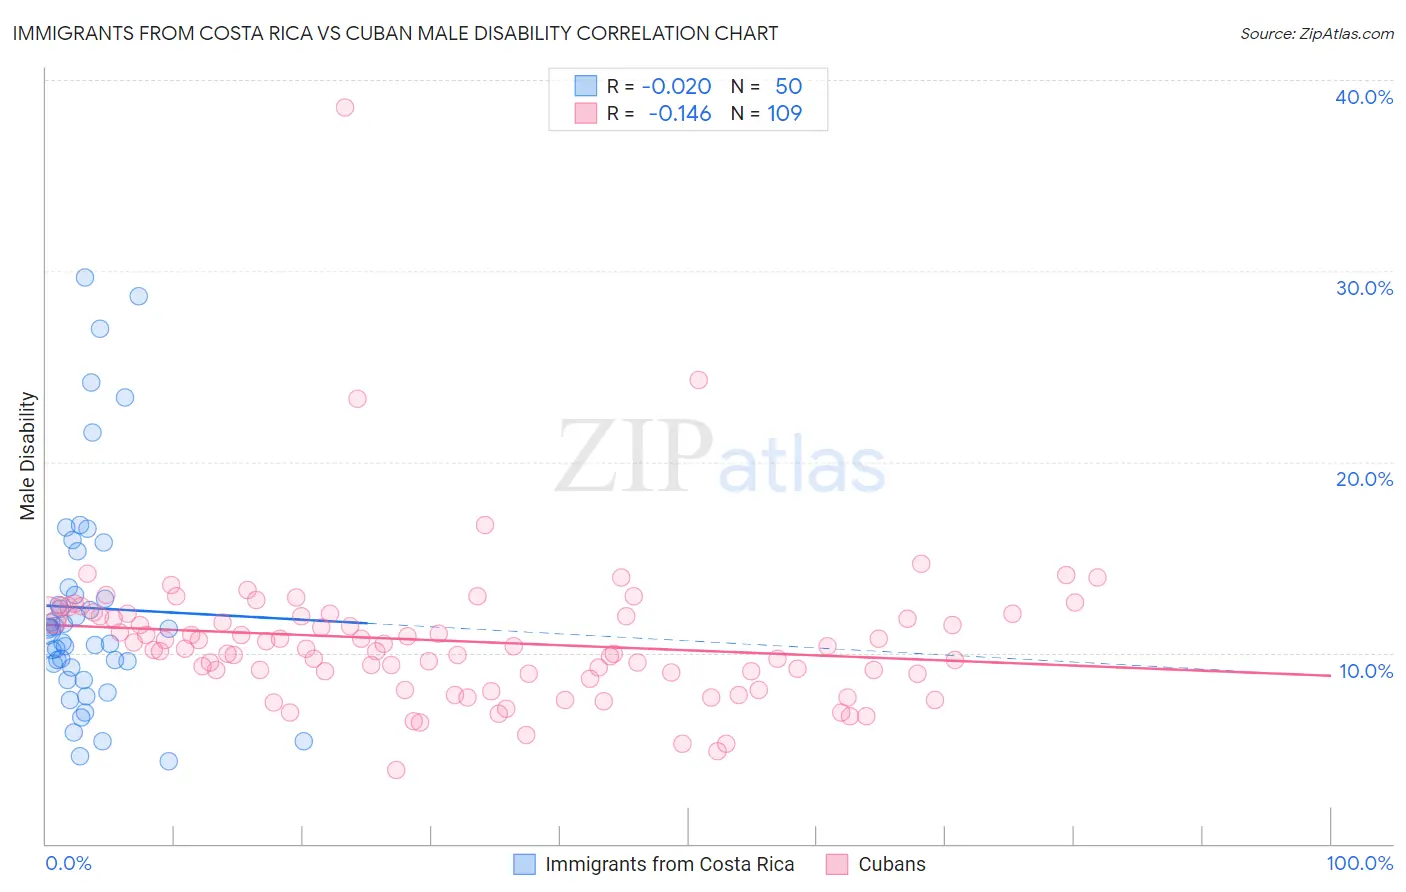
Immigrants from Costa Rica vs Cuban Male Disability Correlation Chart
The statistical analysis conducted on geographies consisting of 204,275,290 people shows no correlation between the proportion of Immigrants from Costa Rica and percentage of males with a disability in the United States with a correlation coefficient (R) of -0.020 and weighted average of 11.0%. Similarly, the statistical analysis conducted on geographies consisting of 449,227,297 people shows a poor negative correlation between the proportion of Cubans and percentage of males with a disability in the United States with a correlation coefficient (R) of -0.146 and weighted average of 11.0%, a difference of 0.68%.
Male Disability Correlation Summary
| Measurement | Immigrants from Costa Rica | Cuban |
| Minimum | 4.3% | 3.9% |
| Maximum | 29.6% | 38.6% |
| Range | 25.3% | 34.7% |
| Mean | 12.4% | 10.6% |
| Median | 11.2% | 10.2% |
| Interquartile 25% (IQ1) | 9.2% | 8.9% |
| Interquartile 75% (IQ3) | 13.4% | 11.9% |
| Interquartile Range (IQR) | 4.2% | 3.0% |
| Standard Deviation (Sample) | 5.9% | 4.0% |
| Standard Deviation (Population) | 5.9% | 4.0% |
Demographics Similar to Immigrants from Costa Rica and Cubans by Male Disability
In terms of male disability, the demographic groups most similar to Immigrants from Costa Rica are Trinidadian and Tobagonian (11.0%, a difference of 0.040%), Bhutanese (11.0%, a difference of 0.060%), Immigrants from Europe (11.0%, a difference of 0.080%), Nigerian (11.0%, a difference of 0.090%), and Ugandan (11.0%, a difference of 0.11%). Similarly, the demographic groups most similar to Cubans are Immigrants from Guatemala (11.0%, a difference of 0.020%), Immigrants from Albania (11.0%, a difference of 0.030%), Immigrants from Denmark (11.0%, a difference of 0.12%), Immigrants from Northern Europe (11.1%, a difference of 0.12%), and Sudanese (11.0%, a difference of 0.17%).
| Demographics | Rating | Rank | Male Disability |
| Ugandans | 83.9 /100 | #133 | Excellent 11.0% |
| Bhutanese | 83.4 /100 | #134 | Excellent 11.0% |
| Trinidadians and Tobagonians | 83.3 /100 | #135 | Excellent 11.0% |
| Immigrants | Costa Rica | 82.8 /100 | #136 | Excellent 11.0% |
| Immigrants | Europe | 82.0 /100 | #137 | Excellent 11.0% |
| Nigerians | 81.9 /100 | #138 | Excellent 11.0% |
| South Africans | 81.7 /100 | #139 | Excellent 11.0% |
| Immigrants | Italy | 81.5 /100 | #140 | Excellent 11.0% |
| Arabs | 81.5 /100 | #141 | Excellent 11.0% |
| Immigrants | Sudan | 81.5 /100 | #142 | Excellent 11.0% |
| Moroccans | 80.7 /100 | #143 | Excellent 11.0% |
| Kenyans | 78.1 /100 | #144 | Good 11.0% |
| Costa Ricans | 78.0 /100 | #145 | Good 11.0% |
| Koreans | 77.5 /100 | #146 | Good 11.0% |
| Immigrants | Croatia | 77.3 /100 | #147 | Good 11.0% |
| Sudanese | 77.1 /100 | #148 | Good 11.0% |
| Immigrants | Denmark | 76.4 /100 | #149 | Good 11.0% |
| Immigrants | Guatemala | 75.1 /100 | #150 | Good 11.0% |
| Cubans | 74.9 /100 | #151 | Good 11.0% |
| Immigrants | Albania | 74.4 /100 | #152 | Good 11.0% |
| Immigrants | Northern Europe | 73.2 /100 | #153 | Good 11.1% |