Immigrants from China vs Spanish American Hearing Disability
COMPARE
Immigrants from China
Spanish American
Hearing Disability
Hearing Disability Comparison
Immigrants from China
Spanish Americans
2.6%
HEARING DISABILITY
99.5/ 100
METRIC RATING
39th/ 347
METRIC RANK
4.0%
HEARING DISABILITY
0.0/ 100
METRIC RATING
316th/ 347
METRIC RANK
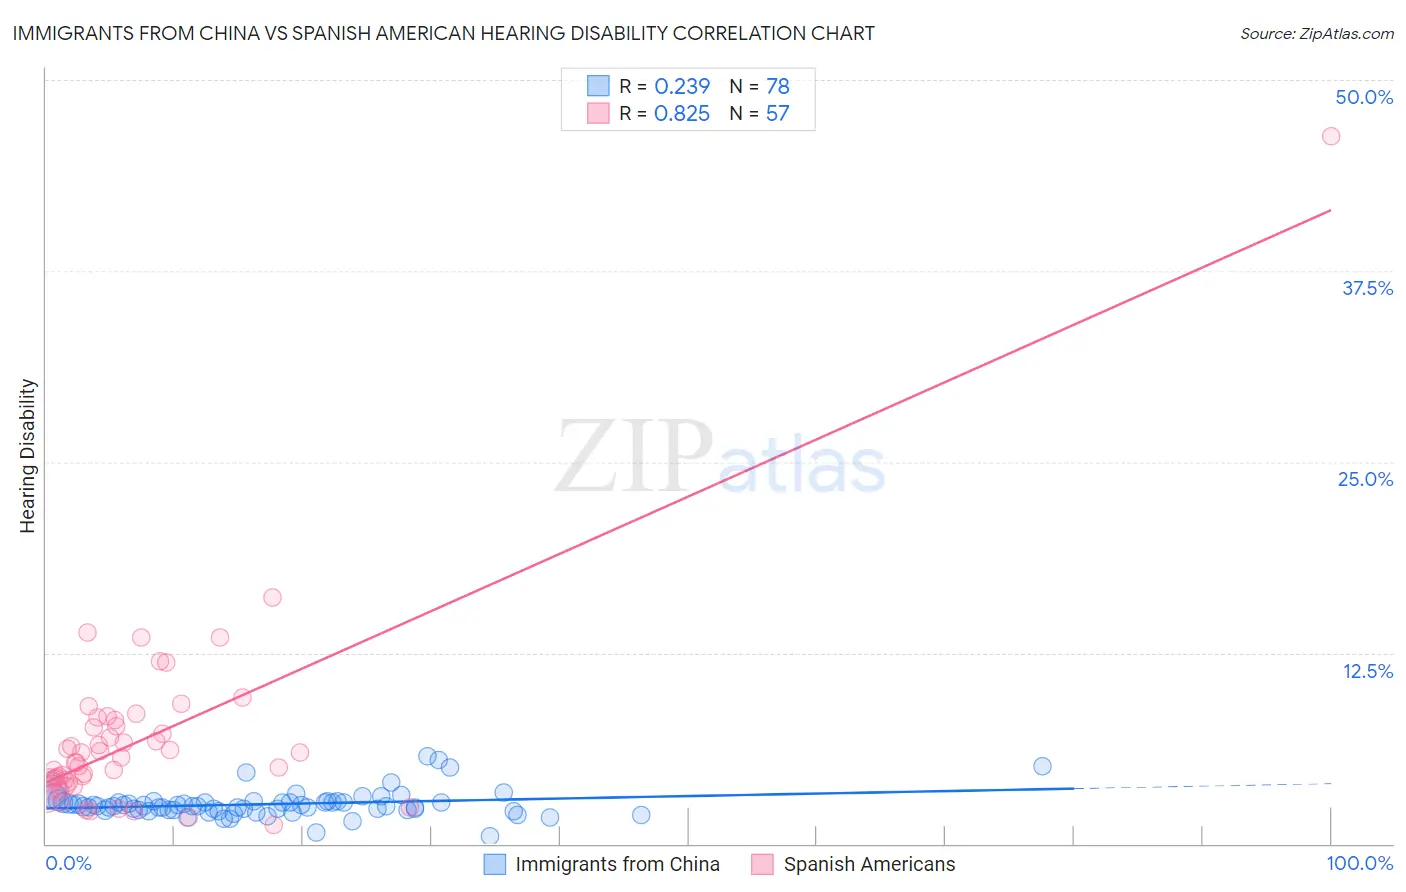
Immigrants from China vs Spanish American Hearing Disability Correlation Chart
The statistical analysis conducted on geographies consisting of 456,804,939 people shows a weak positive correlation between the proportion of Immigrants from China and percentage of population with hearing disability in the United States with a correlation coefficient (R) of 0.239 and weighted average of 2.6%. Similarly, the statistical analysis conducted on geographies consisting of 103,164,367 people shows a very strong positive correlation between the proportion of Spanish Americans and percentage of population with hearing disability in the United States with a correlation coefficient (R) of 0.825 and weighted average of 4.0%, a difference of 50.8%.
Hearing Disability Correlation Summary
| Measurement | Immigrants from China | Spanish American |
| Minimum | 0.45% | 1.3% |
| Maximum | 5.7% | 46.3% |
| Range | 5.2% | 45.0% |
| Mean | 2.6% | 6.8% |
| Median | 2.5% | 5.4% |
| Interquartile 25% (IQ1) | 2.2% | 4.0% |
| Interquartile 75% (IQ3) | 2.7% | 7.9% |
| Interquartile Range (IQR) | 0.49% | 3.9% |
| Standard Deviation (Sample) | 0.87% | 6.3% |
| Standard Deviation (Population) | 0.86% | 6.2% |
Similar Demographics by Hearing Disability
Demographics Similar to Immigrants from China by Hearing Disability
In terms of hearing disability, the demographic groups most similar to Immigrants from China are Haitian (2.6%, a difference of 0.080%), Immigrants from Jamaica (2.6%, a difference of 0.24%), Immigrants from Western Africa (2.6%, a difference of 0.32%), Okinawan (2.6%, a difference of 0.35%), and Immigrants from Taiwan (2.6%, a difference of 0.42%).
| Demographics | Rating | Rank | Hearing Disability |
| Immigrants | Venezuela | 99.7 /100 | #32 | Exceptional 2.6% |
| Filipinos | 99.6 /100 | #33 | Exceptional 2.6% |
| Immigrants | Pakistan | 99.6 /100 | #34 | Exceptional 2.6% |
| Salvadorans | 99.6 /100 | #35 | Exceptional 2.6% |
| Okinawans | 99.6 /100 | #36 | Exceptional 2.6% |
| Immigrants | Western Africa | 99.6 /100 | #37 | Exceptional 2.6% |
| Immigrants | Jamaica | 99.5 /100 | #38 | Exceptional 2.6% |
| Immigrants | China | 99.5 /100 | #39 | Exceptional 2.6% |
| Haitians | 99.5 /100 | #40 | Exceptional 2.6% |
| Immigrants | Taiwan | 99.4 /100 | #41 | Exceptional 2.6% |
| West Indians | 99.4 /100 | #42 | Exceptional 2.6% |
| Senegalese | 99.4 /100 | #43 | Exceptional 2.6% |
| Nigerians | 99.4 /100 | #44 | Exceptional 2.6% |
| Venezuelans | 99.4 /100 | #45 | Exceptional 2.6% |
| Immigrants | Dominica | 99.3 /100 | #46 | Exceptional 2.6% |
Demographics Similar to Spanish Americans by Hearing Disability
In terms of hearing disability, the demographic groups most similar to Spanish Americans are Comanche (4.0%, a difference of 0.13%), Puget Sound Salish (3.9%, a difference of 0.20%), Yakama (3.9%, a difference of 0.21%), Cheyenne (4.0%, a difference of 0.31%), and Hopi (3.9%, a difference of 0.38%).
| Demographics | Rating | Rank | Hearing Disability |
| Scotch-Irish | 0.0 /100 | #309 | Tragic 3.8% |
| Cree | 0.0 /100 | #310 | Tragic 3.8% |
| Americans | 0.0 /100 | #311 | Tragic 3.9% |
| Cajuns | 0.0 /100 | #312 | Tragic 3.9% |
| Hopi | 0.0 /100 | #313 | Tragic 3.9% |
| Yakama | 0.0 /100 | #314 | Tragic 3.9% |
| Puget Sound Salish | 0.0 /100 | #315 | Tragic 3.9% |
| Spanish Americans | 0.0 /100 | #316 | Tragic 4.0% |
| Comanche | 0.0 /100 | #317 | Tragic 4.0% |
| Cheyenne | 0.0 /100 | #318 | Tragic 4.0% |
| Chippewa | 0.0 /100 | #319 | Tragic 4.0% |
| Shoshone | 0.0 /100 | #320 | Tragic 4.0% |
| Paiute | 0.0 /100 | #321 | Tragic 4.1% |
| Seminole | 0.0 /100 | #322 | Tragic 4.1% |
| Apache | 0.0 /100 | #323 | Tragic 4.1% |