Immigrants from Central America vs Immigrants from Armenia Disability Age 35 to 64

COMPARE

Immigrants from Central America
Race
Ancestry
AfghanAfricanAlaska NativeAlaskan AthabascanAlbanianAleutAlsatianAmericanApacheArabArapahoArgentineanArmenianAssyrian/Chaldean/SyriacAustralianAustrianBahamianBangladeshiBarbadianBasqueBelgianBelizeanBermudanBhutaneseBlackfeetBolivianBrazilianBritishBritish West IndianBulgarianBurmeseCajunCambodianCanadianCape VerdeanCarpatho RusynCelticCentral AmericanCentral American IndianCherokeeCheyenneChickasawChileanChineseChippewaChoctawColombianColvilleComancheCosta RicanCreeCreekCroatianCrowCubanCypriotCzechCzechoslovakianDanishDelawareDominicanDutchDutch West IndianEastern EuropeanEcuadorianEgyptianEnglishEstonianEthiopianEuropeanFijianFilipinoFinnishFrenchFrench American IndianFrench CanadianGermanGerman RussianGhanaianGreekGuamanian/ChamorroGuatemalanGuyaneseHaitianHmongHonduranHopiHoumaHungarianIcelanderIndian (Asian)IndonesianInupiatIranianIraqiIrishIroquoisIsraeliItalianJamaicanJapaneseJordanianKenyanKiowaKoreanLaotianLatvianLebaneseLiberianLithuanianLumbeeLuxembourgerMacedonianMalaysianMalteseMarshalleseMenomineeMexicanMexican American IndianMongolianMoroccanNative HawaiianNavajoNepaleseNew ZealanderNicaraguanNigerianNorthern EuropeanNorwegianOkinawanOsageOttawaPaiutePakistaniPalestinianPanamanianParaguayanPennsylvania GermanPeruvianPimaPolishPortuguesePotawatomiPuebloPuerto RicanPuget Sound SalishRomanianRussianSalvadoranSamoanScandinavianScotch-IrishScottishSeminoleSenegaleseSerbianShoshoneSierra LeoneanSiouxSlavicSlovakSloveneSomaliSouth AfricanSouth AmericanSouth American IndianSoviet UnionSpaniardSpanishSpanish AmericanSpanish American IndianSri LankanSubsaharan AfricanSudaneseSwedishSwissSyrianTaiwaneseThaiTlingit-HaidaTohono O'OdhamTonganTrinidadian and TobagonianTsimshianTurkishU.S. Virgin IslanderUgandanUkrainianUruguayanUteVenezuelanVietnameseWelshWest IndianYakamaYaquiYugoslavianYumanYup'ikZimbabwean
Immigration
NonimmigrantsImmigrantsAfghanistanAfricaAlbaniaArgentinaAsiaAustraliaAustriaBahamasBangladeshBarbadosBelarusBelgiumBelizeBoliviaBosnia and HerzegovinaBrazilBulgariaBurma/MyanmarCabo VerdeCambodiaCameroonCanadaCaribbeanCentral AmericaChileChinaColombiaCongoCosta RicaCroatiaCubaCzechoslovakiaDenmarkDominicaDominican RepublicEastern AfricaEastern AsiaEastern EuropeEcuadorEgyptEl SalvadorEnglandEritreaEthiopiaEuropeFijiFranceGermanyGhanaGreeceGrenadaGuatemalaGuyanaHaitiHondurasHong KongHungaryIndiaIndonesiaIranIraqIrelandIsraelItalyJamaicaJapanJordanKazakhstanKenyaKoreaKuwaitLaosLatin AmericaLatviaLebanonLiberiaLithuaniaMalaysiaMexicoMicronesiaMiddle AfricaMoldovaMoroccoNepalNetherlandsNicaraguaNigeriaNorth AmericaNorth MacedoniaNorthern AfricaNorthern EuropeNorwayOceaniaPakistanPanamaPeruPhilippinesPolandPortugalRomaniaRussiaSaudi ArabiaScotlandSenegalSerbiaSierra LeoneSingaporeSomaliaSouth AfricaSouth AmericaSouth Central AsiaSouth Eastern AsiaSouthern EuropeSpainSri LankaSt. Vincent and the GrenadinesSudanSwedenSwitzerlandSyriaTaiwanThailandTrinidad and TobagoTurkeyUgandaUkraineUruguayUzbekistanVenezuelaVietnamWest IndiesWestern AfricaWestern AsiaWestern EuropeYemenZaireZimbabweAzores
Immigrants from Armenia
Race
Ancestry
AfghanAfricanAlaska NativeAlaskan AthabascanAlbanianAleutAlsatianAmericanApacheArabArapahoArgentineanArmenianAssyrian/Chaldean/SyriacAustralianAustrianBahamianBangladeshiBarbadianBasqueBelgianBelizeanBermudanBhutaneseBlackfeetBolivianBrazilianBritishBritish West IndianBulgarianBurmeseCajunCambodianCanadianCape VerdeanCarpatho RusynCelticCentral AmericanCentral American IndianCherokeeCheyenneChickasawChileanChineseChippewaChoctawColombianColvilleComancheCosta RicanCreeCreekCroatianCrowCubanCypriotCzechCzechoslovakianDanishDelawareDominicanDutchDutch West IndianEastern EuropeanEcuadorianEgyptianEnglishEstonianEthiopianEuropeanFijianFilipinoFinnishFrenchFrench American IndianFrench CanadianGermanGerman RussianGhanaianGreekGuamanian/ChamorroGuatemalanGuyaneseHaitianHmongHonduranHopiHoumaHungarianIcelanderIndian (Asian)IndonesianInupiatIranianIraqiIrishIroquoisIsraeliItalianJamaicanJapaneseJordanianKenyanKiowaKoreanLaotianLatvianLebaneseLiberianLithuanianLumbeeLuxembourgerMacedonianMalaysianMalteseMarshalleseMenomineeMexicanMexican American IndianMongolianMoroccanNative HawaiianNavajoNepaleseNew ZealanderNicaraguanNigerianNorthern EuropeanNorwegianOkinawanOsageOttawaPaiutePakistaniPalestinianPanamanianParaguayanPennsylvania GermanPeruvianPimaPolishPortuguesePotawatomiPuebloPuerto RicanPuget Sound SalishRomanianRussianSalvadoranSamoanScandinavianScotch-IrishScottishSeminoleSenegaleseSerbianShoshoneSierra LeoneanSiouxSlavicSlovakSloveneSomaliSouth AfricanSouth AmericanSouth American IndianSoviet UnionSpaniardSpanishSpanish AmericanSpanish American IndianSri LankanSubsaharan AfricanSudaneseSwedishSwissSyrianTaiwaneseThaiTlingit-HaidaTohono O'OdhamTonganTrinidadian and TobagonianTsimshianTurkishU.S. Virgin IslanderUgandanUkrainianUruguayanUteVenezuelanVietnameseWelshWest IndianYakamaYaquiYugoslavianYumanYup'ikZimbabwean
Immigration
NonimmigrantsImmigrantsAfghanistanAfricaAlbaniaArgentinaArmeniaAsiaAustraliaAustriaBahamasBangladeshBarbadosBelarusBelgiumBelizeBoliviaBosnia and HerzegovinaBrazilBulgariaBurma/MyanmarCabo VerdeCambodiaCameroonCanadaCaribbeanChileChinaColombiaCongoCosta RicaCroatiaCubaCzechoslovakiaDenmarkDominicaDominican RepublicEastern AfricaEastern AsiaEastern EuropeEcuadorEgyptEl SalvadorEnglandEritreaEthiopiaEuropeFijiFranceGermanyGhanaGreeceGrenadaGuatemalaGuyanaHaitiHondurasHong KongHungaryIndiaIndonesiaIranIraqIrelandIsraelItalyJamaicaJapanJordanKazakhstanKenyaKoreaKuwaitLaosLatin AmericaLatviaLebanonLiberiaLithuaniaMalaysiaMexicoMicronesiaMiddle AfricaMoldovaMoroccoNepalNetherlandsNicaraguaNigeriaNorth AmericaNorth MacedoniaNorthern AfricaNorthern EuropeNorwayOceaniaPakistanPanamaPeruPhilippinesPolandPortugalRomaniaRussiaSaudi ArabiaScotlandSenegalSerbiaSierra LeoneSingaporeSomaliaSouth AfricaSouth AmericaSouth Central AsiaSouth Eastern AsiaSouthern EuropeSpainSri LankaSt. Vincent and the GrenadinesSudanSwedenSwitzerlandSyriaTaiwanThailandTrinidad and TobagoTurkeyUgandaUkraineUruguayUzbekistanVenezuelaVietnamWest IndiesWestern AfricaWestern AsiaWestern EuropeYemenZaireZimbabweAzores
Disability Age 35 to 64
Income
Poverty
Unemployment
Labor Participation
Family Structure
Vehicle Availability
Education Level
Disability

Disability Age 35 to 64 Comparison

Immigrants from Central America

Immigrants from Armenia

Tragic
Exceptional
11.9%
DISABILITY AGE 35 TO 64
6.3/ 100
METRIC RATING
227th/ 347
METRIC RANK
9.7%
DISABILITY AGE 35 TO 64
99.9/ 100
METRIC RATING
40th/ 347
METRIC RANK

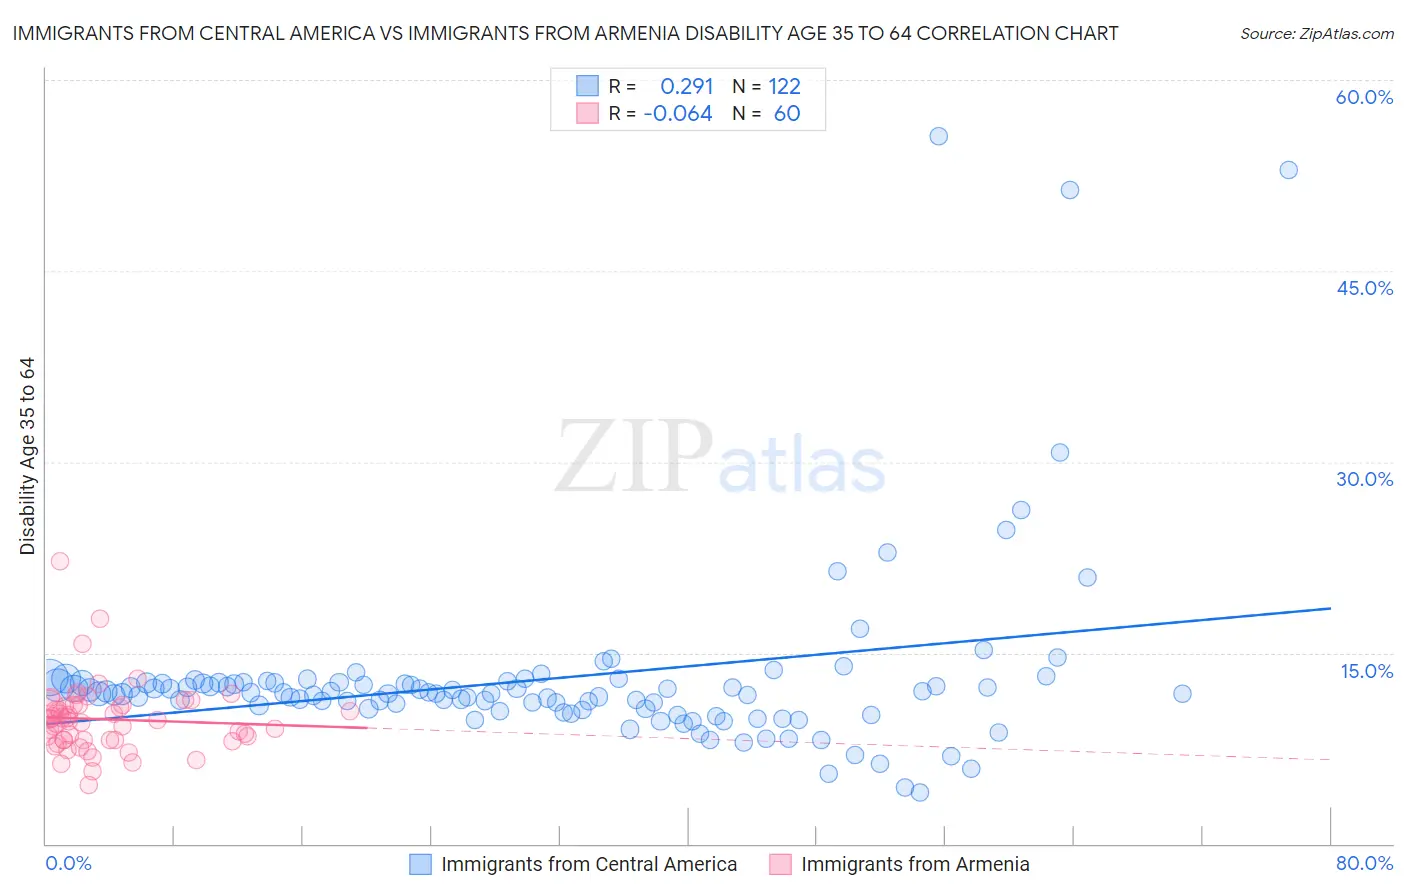
Immigrants from Central America vs Immigrants from Armenia Disability Age 35 to 64 Correlation Chart

The statistical analysis conducted on geographies consisting of 535,835,768 people shows a weak positive correlation between the proportion of Immigrants from Central America and percentage of population with a disability between the ages 34 and 64 in the United States with a correlation coefficient (R) of 0.291 and weighted average of 11.9%. Similarly, the statistical analysis conducted on geographies consisting of 97,707,471 people shows a slight negative correlation between the proportion of Immigrants from Armenia and percentage of population with a disability between the ages 34 and 64 in the United States with a correlation coefficient (R) of -0.064 and weighted average of 9.7%, a difference of 22.3%.
Immigrants from Central America vs Immigrants from Armenia Disability Age 35 to 64

Disability Age 35 to 64 Correlation Summary

MeasurementImmigrants from Central AmericaImmigrants from Armenia
Minimum4.0%4.6%
Maximum55.6%22.1%
Range51.5%17.5%
Mean12.9%9.8%
Median11.8%9.7%
Interquartile 25% (IQ1)10.6%8.2%
Interquartile 75% (IQ3)12.6%10.8%
Interquartile Range (IQR)2.0%2.7%
Standard Deviation (Sample)7.4%2.7%
Standard Deviation (Population)7.3%2.7%

Similar Demographics by Disability Age 35 to 64

Demographics Similar to Immigrants from Central America by Disability Age 35 to 64

In terms of disability age 35 to 64, the demographic groups most similar to Immigrants from Central America are Scandinavian (11.9%, a difference of 0.030%), Immigrants from Germany (11.9%, a difference of 0.030%), British West Indian (11.9%, a difference of 0.060%), Immigrants from Belize (11.9%, a difference of 0.11%), and Panamanian (11.9%, a difference of 0.16%).
DemographicsRating | RankDisability Age 35 to 64
Immigrants | West Indies
8.9
/100
|
#220
Tragic
11.8%
Alsatians
8.5
/100
|
#221
Tragic
11.8%
Hondurans
8.4
/100
|
#222
Tragic
11.8%
Immigrants | Honduras
8.4
/100
|
#223
Tragic
11.8%
Immigrants | Ghana
7.8
/100
|
#224
Tragic
11.8%
Immigrants | Belize
6.6
/100
|
#225
Tragic
11.9%
Scandinavians
6.4
/100
|
#226
Tragic
11.9%
Immigrants | Central America
6.3
/100
|
#227
Tragic
11.9%
Immigrants | Germany
6.2
/100
|
#228
Tragic
11.9%
British West Indians
6.1
/100
|
#229
Tragic
11.9%
Panamanians
5.8
/100
|
#230
Tragic
11.9%
Jamaicans
5.7
/100
|
#231
Tragic
11.9%
Sudanese
5.3
/100
|
#232
Tragic
11.9%
Bermudans
5.0
/100
|
#233
Tragic
11.9%
Portuguese
4.9
/100
|
#234
Tragic
11.9%

Demographics Similar to Immigrants from Armenia by Disability Age 35 to 64

In terms of disability age 35 to 64, the demographic groups most similar to Immigrants from Armenia are Immigrants from Belarus (9.7%, a difference of 0.070%), Israeli (9.7%, a difference of 0.12%), Egyptian (9.7%, a difference of 0.23%), Immigrants from Turkey (9.7%, a difference of 0.30%), and Immigrants from Malaysia (9.7%, a difference of 0.35%).
DemographicsRating | RankDisability Age 35 to 64
Immigrants | Indonesia
99.9
/100
|
#33
Exceptional
9.7%
Immigrants | Australia
99.9
/100
|
#34
Exceptional
9.7%
Bulgarians
99.9
/100
|
#35
Exceptional
9.7%
Immigrants | Cuba
99.9
/100
|
#36
Exceptional
9.7%
Immigrants | Turkey
99.9
/100
|
#37
Exceptional
9.7%
Egyptians
99.9
/100
|
#38
Exceptional
9.7%
Immigrants | Belarus
99.9
/100
|
#39
Exceptional
9.7%
Immigrants | Armenia
99.9
/100
|
#40
Exceptional
9.7%
Israelis
99.9
/100
|
#41
Exceptional
9.7%
Immigrants | Malaysia
99.9
/100
|
#42
Exceptional
9.7%
Immigrants | Colombia
99.9
/100
|
#43
Exceptional
9.8%
Immigrants | Egypt
99.9
/100
|
#44
Exceptional
9.8%
Immigrants | Peru
99.9
/100
|
#45
Exceptional
9.8%
Cambodians
99.8
/100
|
#46
Exceptional
9.8%
Immigrants | Belgium
99.8
/100
|
#47
Exceptional
9.8%