Immigrants from Central America vs Ghanaian Disability Age 35 to 64
COMPARE
Immigrants from Central America
Ghanaian
Disability Age 35 to 64
Disability Age 35 to 64 Comparison
Immigrants from Central America
Ghanaians
11.9%
DISABILITY AGE 35 TO 64
6.3/ 100
METRIC RATING
227th/ 347
METRIC RANK
11.7%
DISABILITY AGE 35 TO 64
14.8/ 100
METRIC RATING
207th/ 347
METRIC RANK
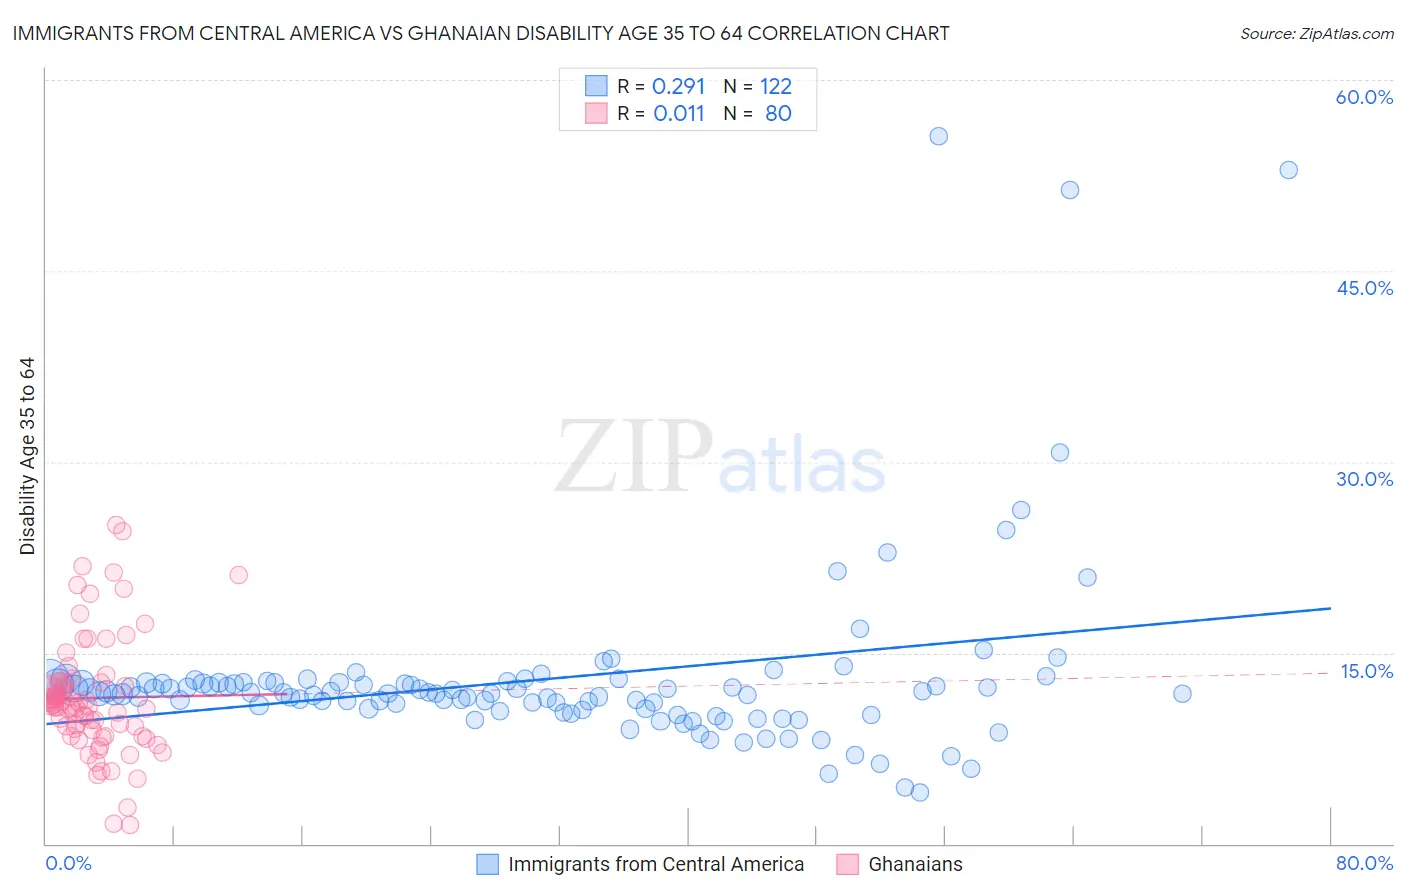
Immigrants from Central America vs Ghanaian Disability Age 35 to 64 Correlation Chart
The statistical analysis conducted on geographies consisting of 535,835,768 people shows a weak positive correlation between the proportion of Immigrants from Central America and percentage of population with a disability between the ages 34 and 64 in the United States with a correlation coefficient (R) of 0.291 and weighted average of 11.9%. Similarly, the statistical analysis conducted on geographies consisting of 190,523,833 people shows no correlation between the proportion of Ghanaians and percentage of population with a disability between the ages 34 and 64 in the United States with a correlation coefficient (R) of 0.011 and weighted average of 11.7%, a difference of 1.9%.
Disability Age 35 to 64 Correlation Summary
| Measurement | Immigrants from Central America | Ghanaian |
| Minimum | 4.0% | 1.4% |
| Maximum | 55.6% | 25.0% |
| Range | 51.5% | 23.6% |
| Mean | 12.9% | 11.4% |
| Median | 11.8% | 10.8% |
| Interquartile 25% (IQ1) | 10.6% | 8.7% |
| Interquartile 75% (IQ3) | 12.6% | 12.7% |
| Interquartile Range (IQR) | 2.0% | 4.0% |
| Standard Deviation (Sample) | 7.4% | 4.7% |
| Standard Deviation (Population) | 7.3% | 4.6% |
Demographics Similar to Immigrants from Central America and Ghanaians by Disability Age 35 to 64
In terms of disability age 35 to 64, the demographic groups most similar to Immigrants from Central America are Scandinavian (11.9%, a difference of 0.030%), Immigrants from Belize (11.9%, a difference of 0.11%), Immigrants from Ghana (11.8%, a difference of 0.46%), Immigrants from Honduras (11.8%, a difference of 0.61%), and Honduran (11.8%, a difference of 0.62%). Similarly, the demographic groups most similar to Ghanaians are Guatemalan (11.7%, a difference of 0.030%), European (11.7%, a difference of 0.22%), Belgian (11.7%, a difference of 0.29%), Canadian (11.7%, a difference of 0.30%), and Immigrants from Jamaica (11.7%, a difference of 0.52%).
| Demographics | Rating | Rank | Disability Age 35 to 64 |
| Ghanaians | 14.8 /100 | #207 | Poor 11.7% |
| Guatemalans | 14.6 /100 | #208 | Poor 11.7% |
| Europeans | 13.5 /100 | #209 | Poor 11.7% |
| Belgians | 13.1 /100 | #210 | Poor 11.7% |
| Canadians | 13.0 /100 | #211 | Poor 11.7% |
| Immigrants | Jamaica | 11.8 /100 | #212 | Poor 11.7% |
| Yugoslavians | 11.6 /100 | #213 | Poor 11.7% |
| Immigrants | Sudan | 11.4 /100 | #214 | Poor 11.7% |
| Spanish American Indians | 11.1 /100 | #215 | Poor 11.7% |
| Bahamians | 10.7 /100 | #216 | Poor 11.8% |
| Barbadians | 9.5 /100 | #217 | Tragic 11.8% |
| Immigrants | Bahamas | 9.2 /100 | #218 | Tragic 11.8% |
| Czechoslovakians | 9.0 /100 | #219 | Tragic 11.8% |
| Immigrants | West Indies | 8.9 /100 | #220 | Tragic 11.8% |
| Alsatians | 8.5 /100 | #221 | Tragic 11.8% |
| Hondurans | 8.4 /100 | #222 | Tragic 11.8% |
| Immigrants | Honduras | 8.4 /100 | #223 | Tragic 11.8% |
| Immigrants | Ghana | 7.8 /100 | #224 | Tragic 11.8% |
| Immigrants | Belize | 6.6 /100 | #225 | Tragic 11.9% |
| Scandinavians | 6.4 /100 | #226 | Tragic 11.9% |
| Immigrants | Central America | 6.3 /100 | #227 | Tragic 11.9% |